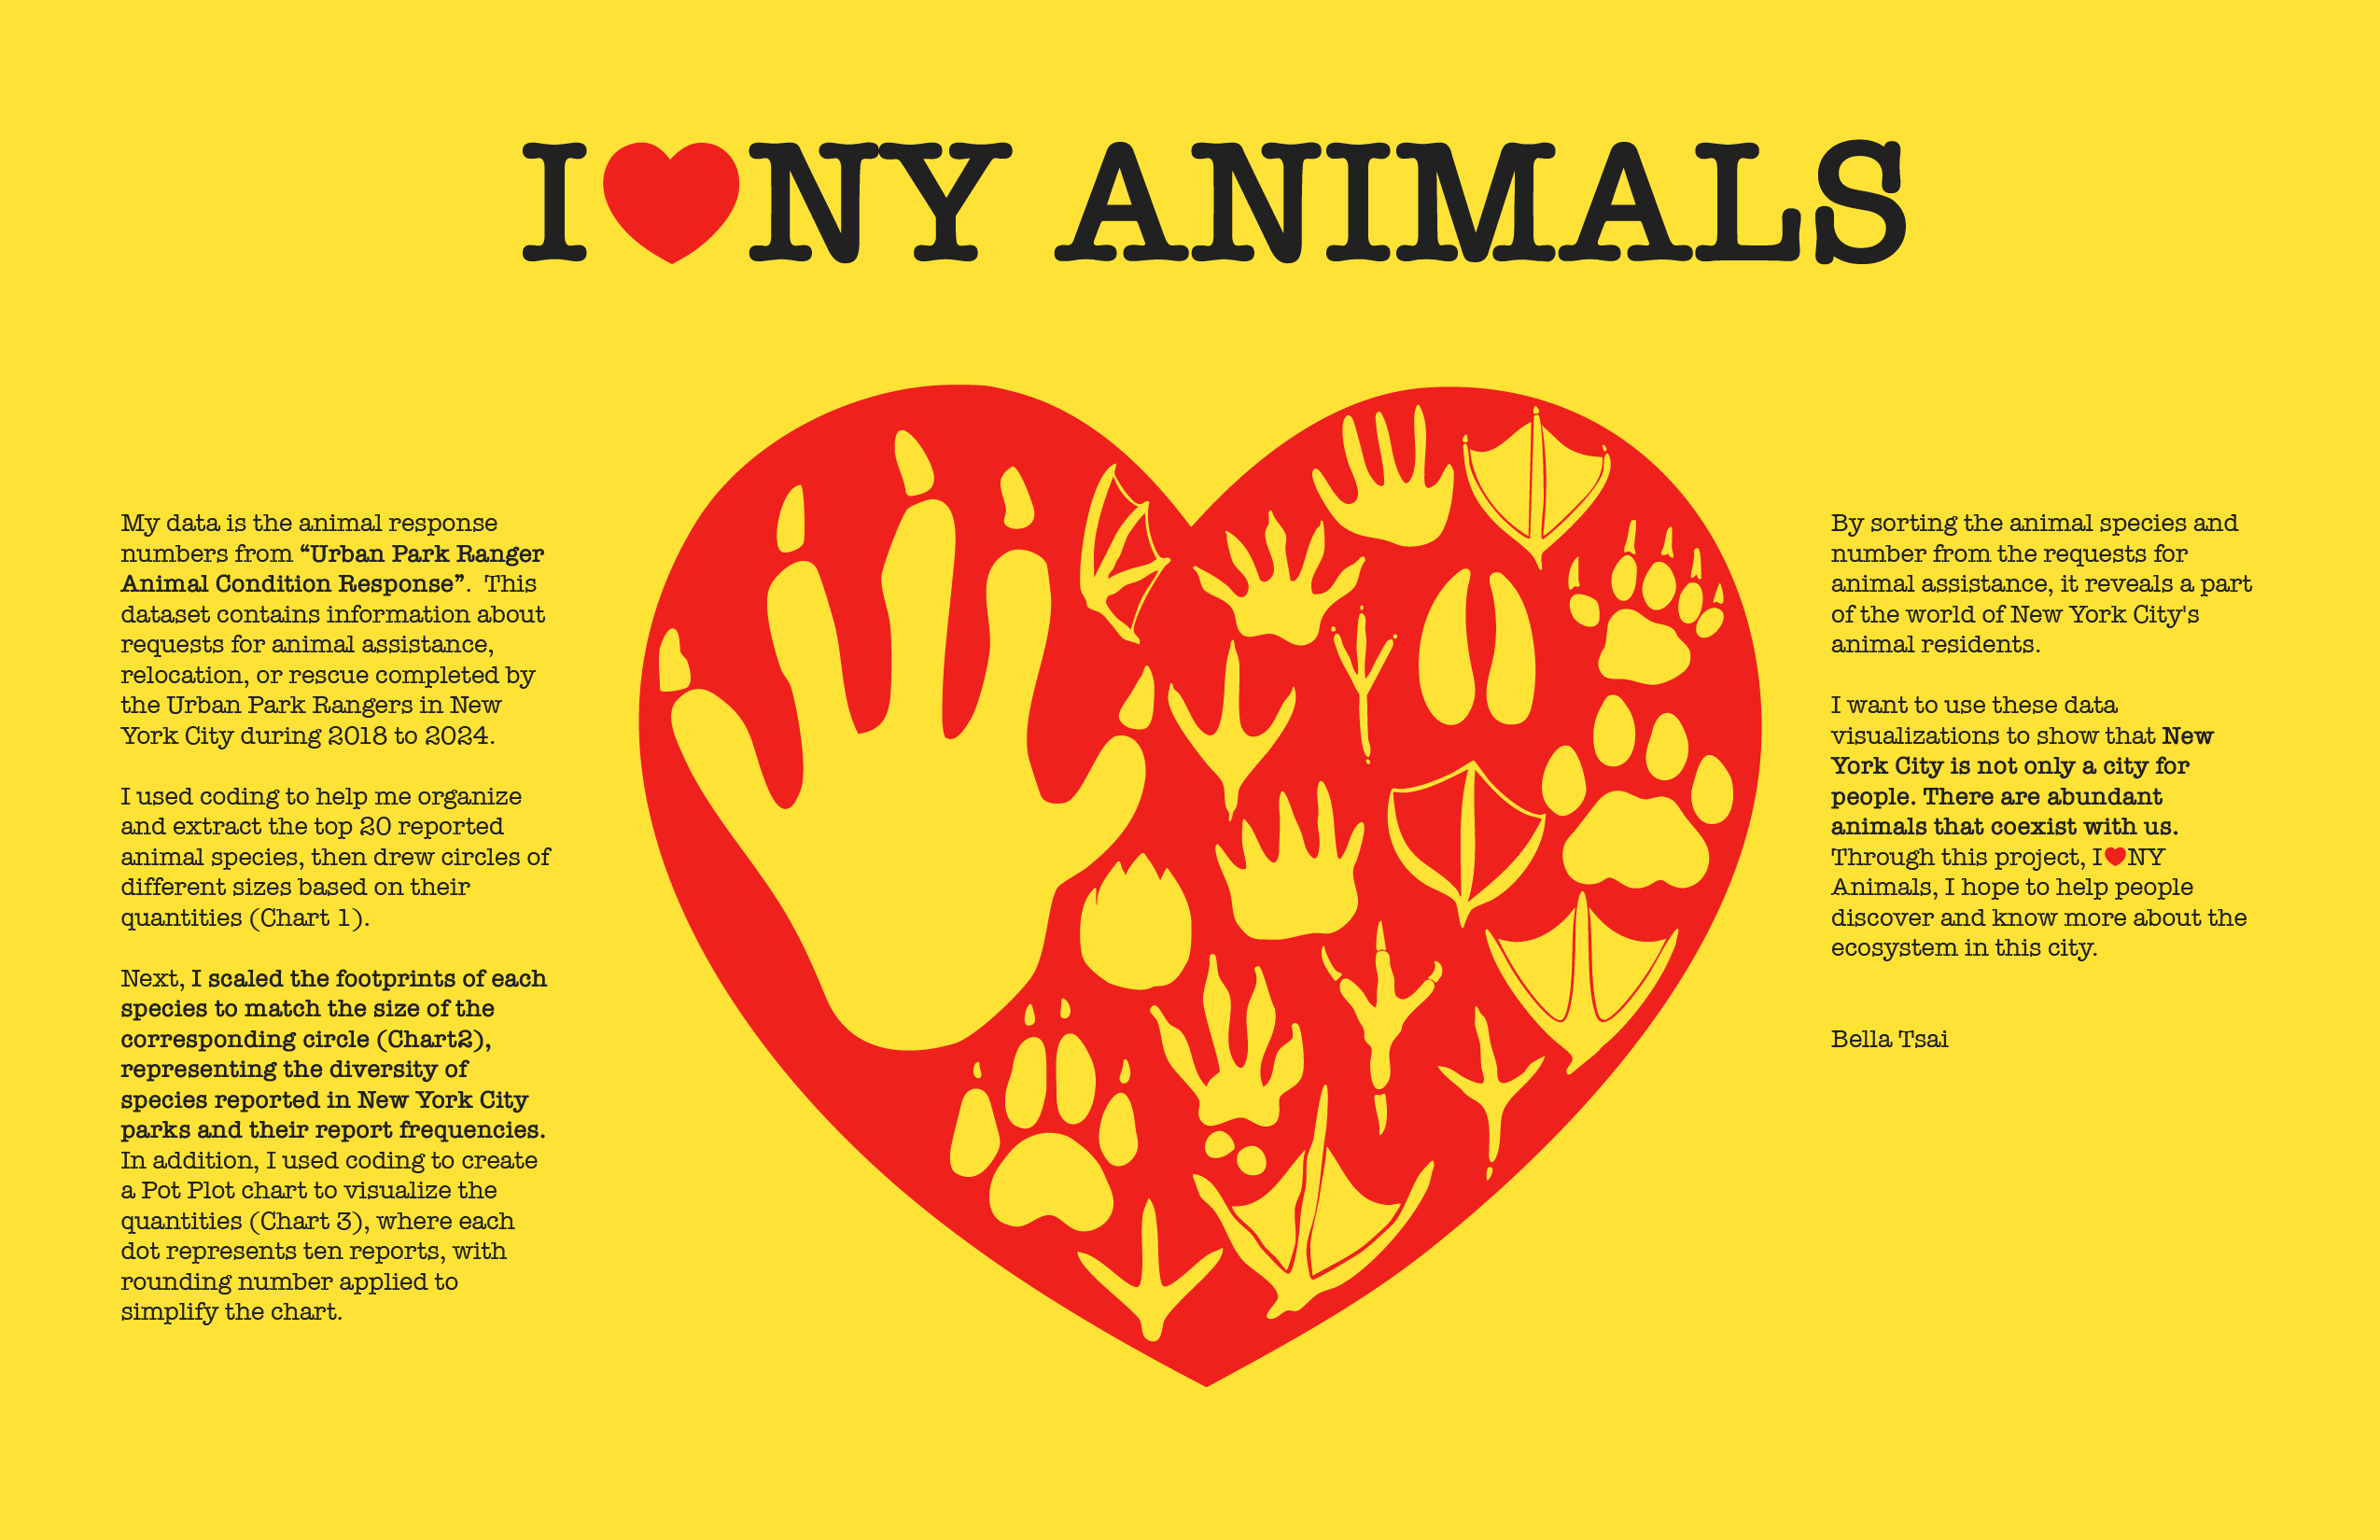
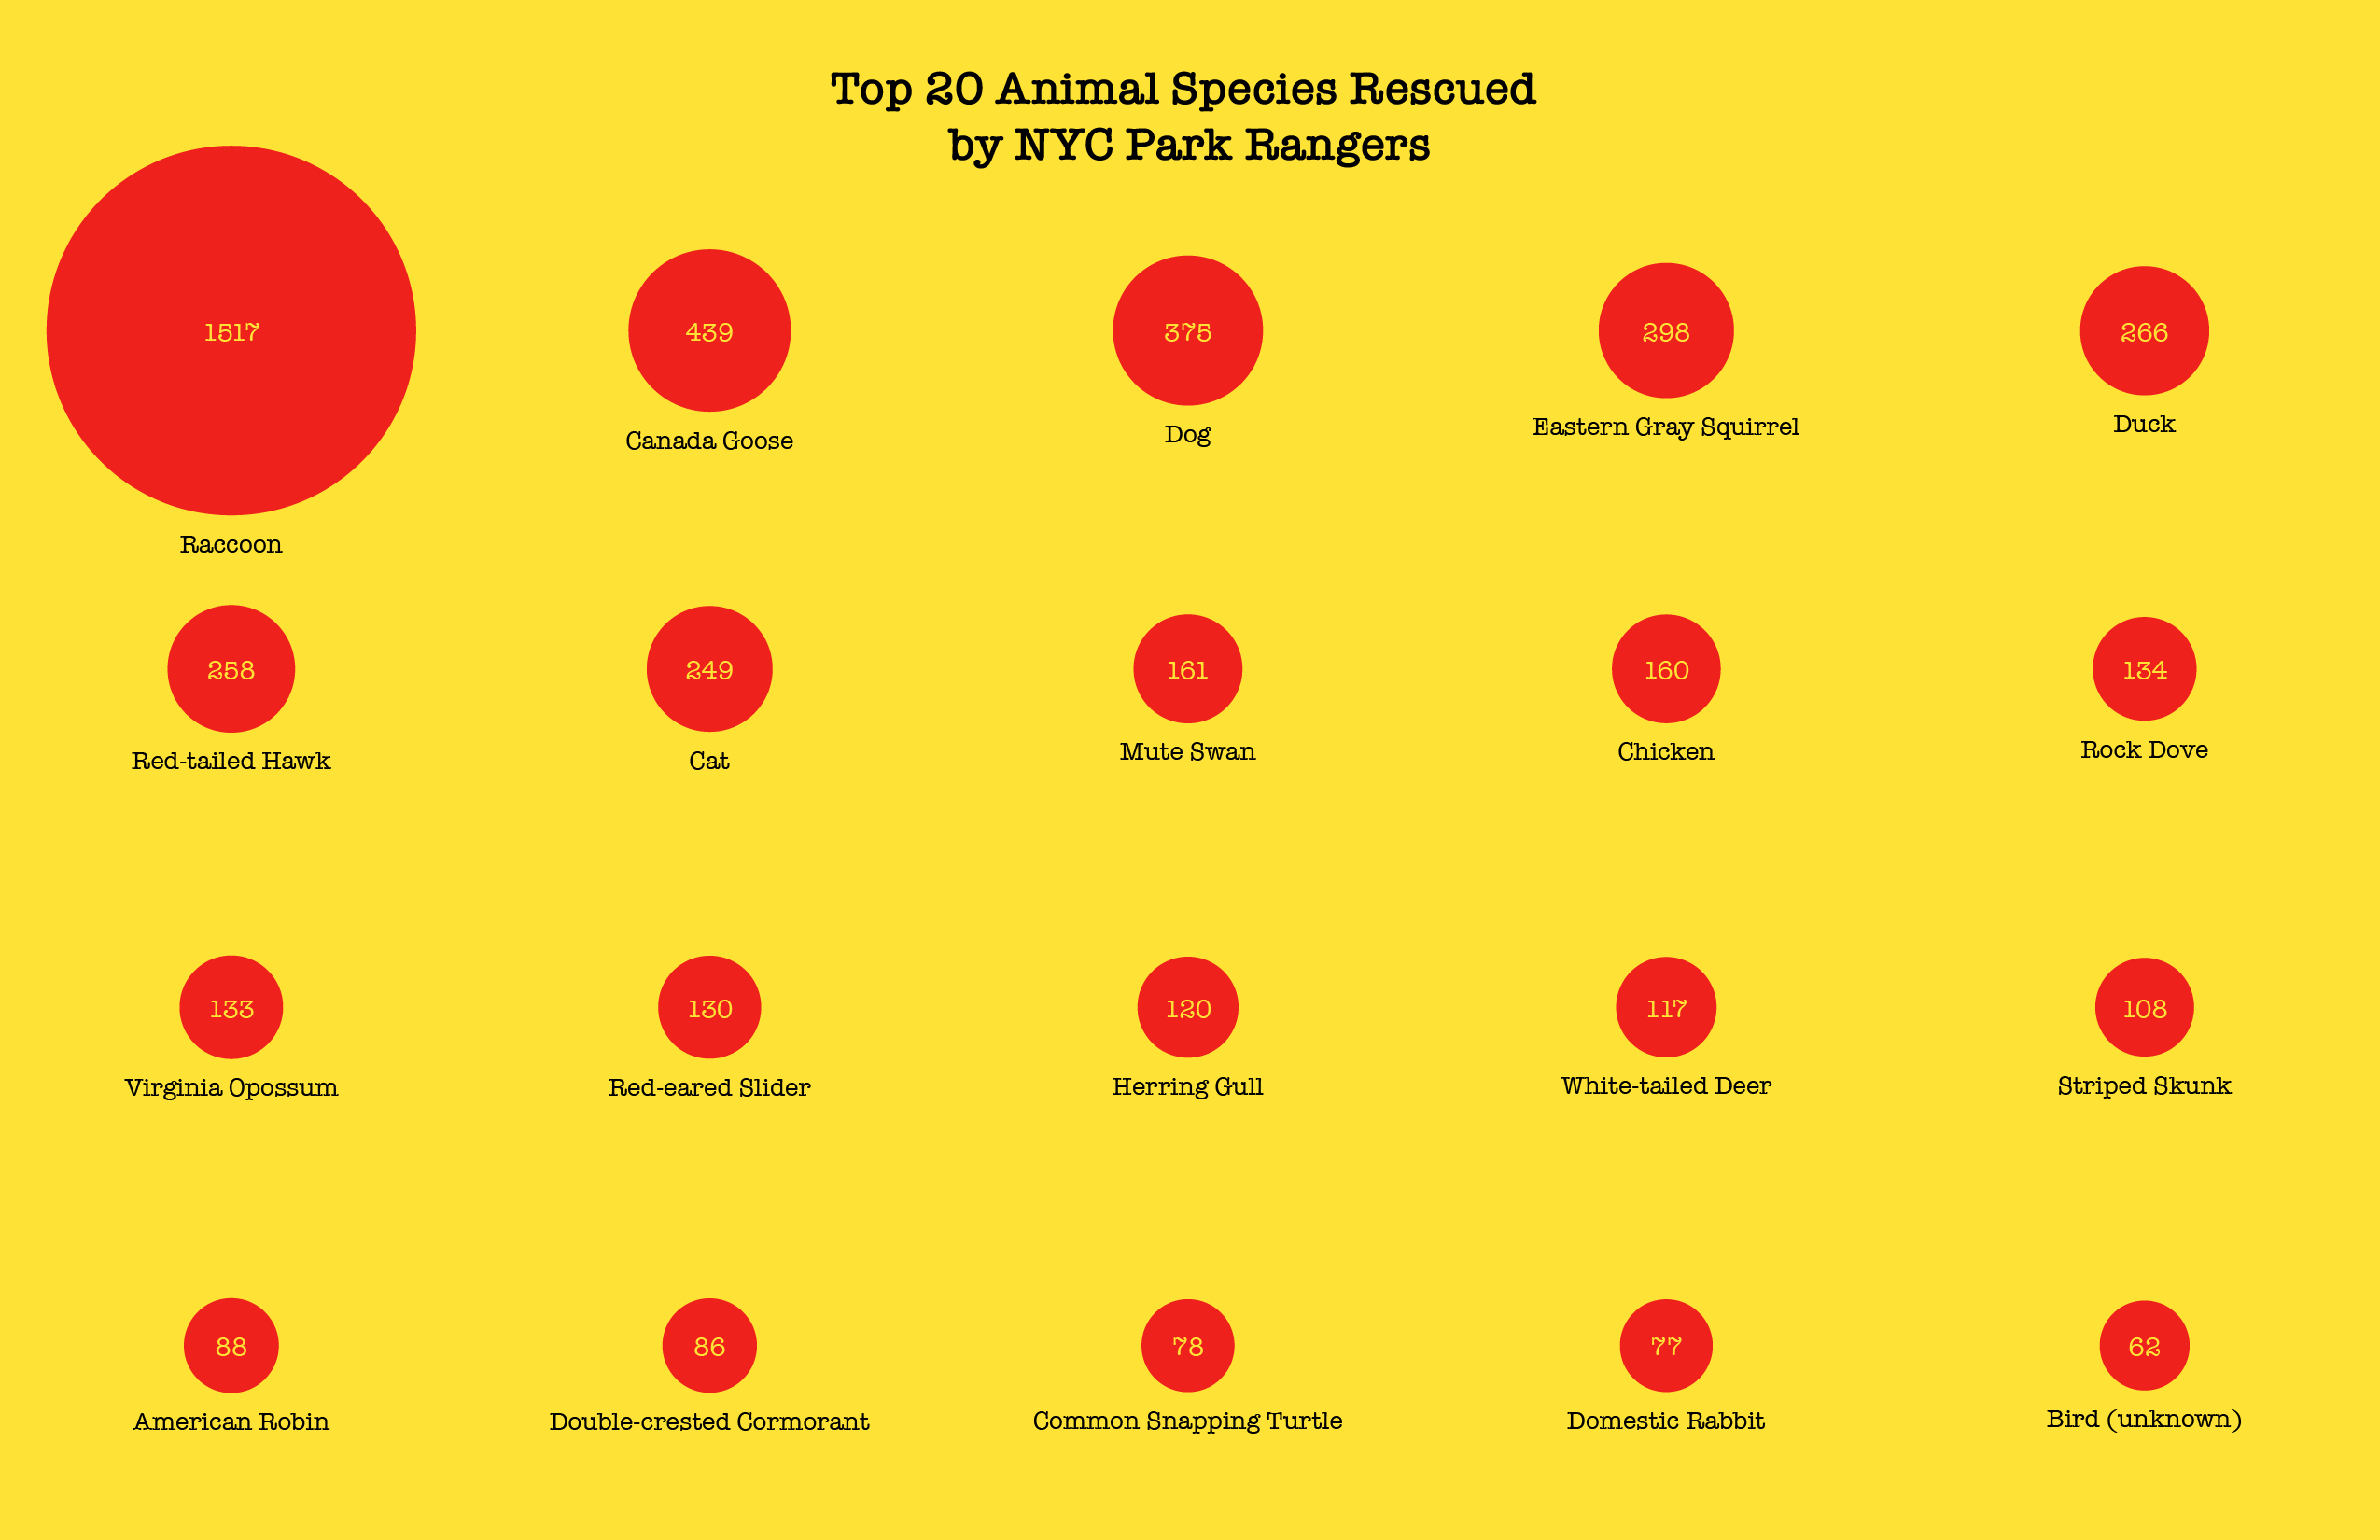
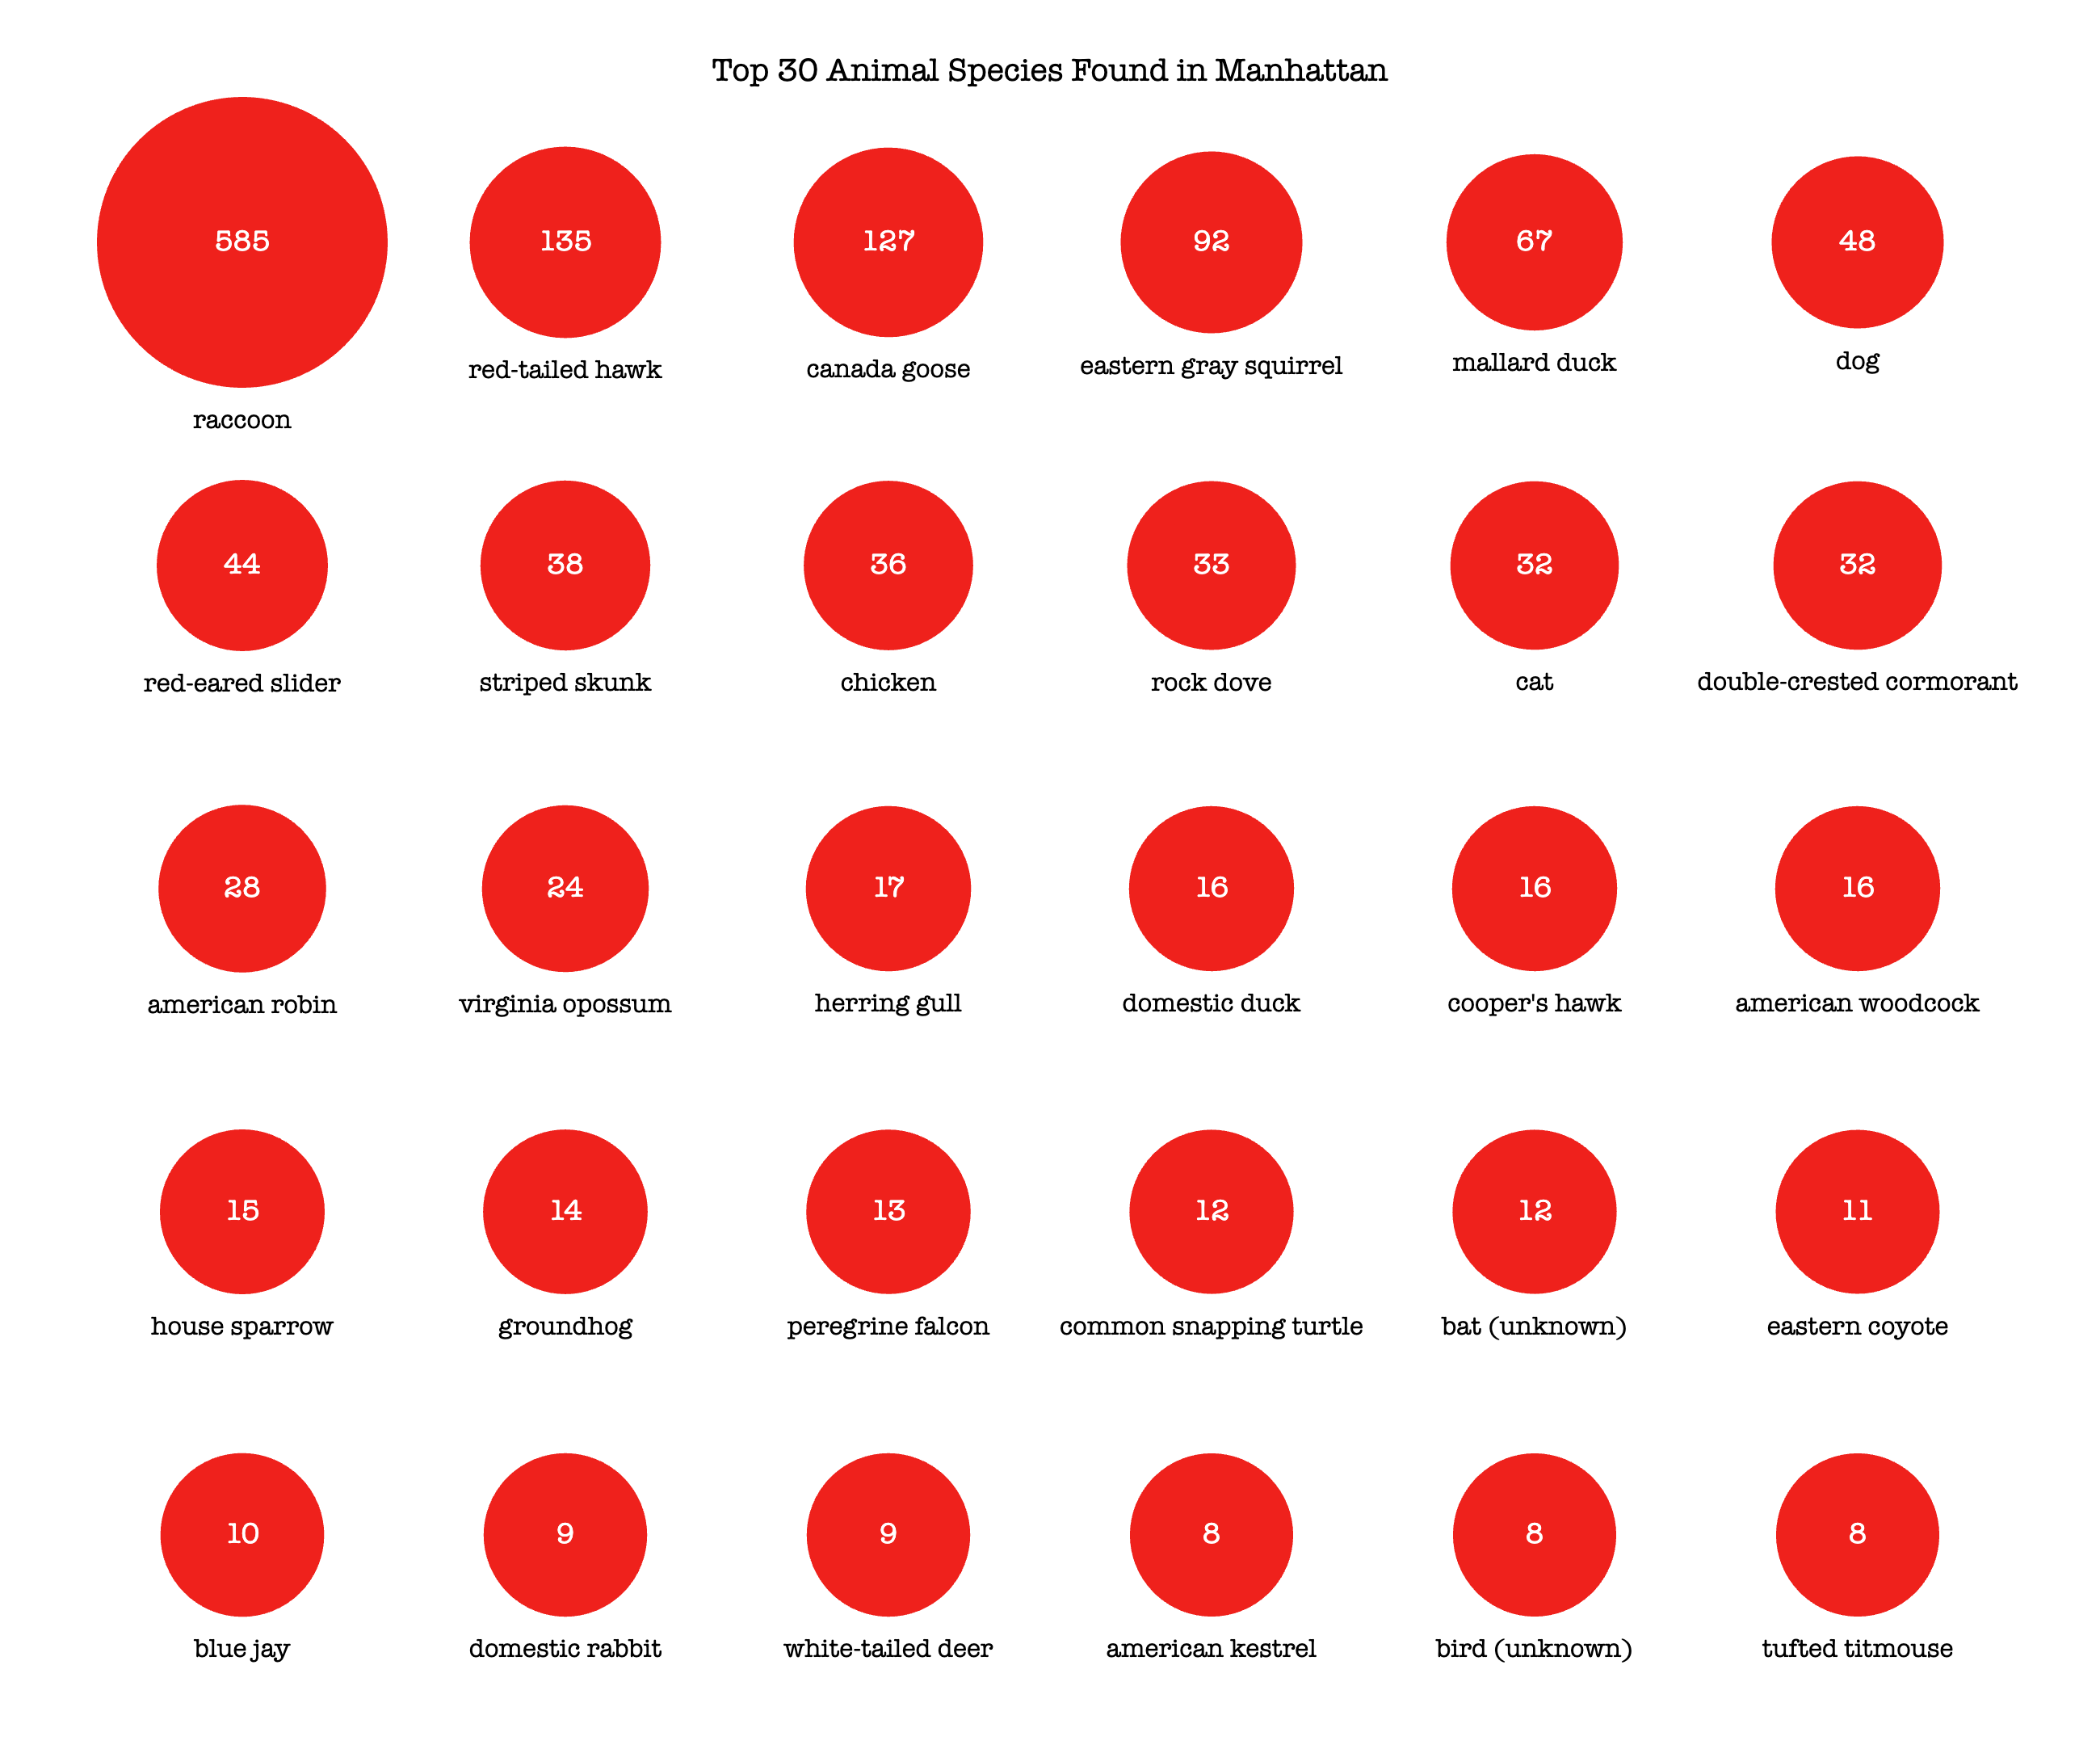
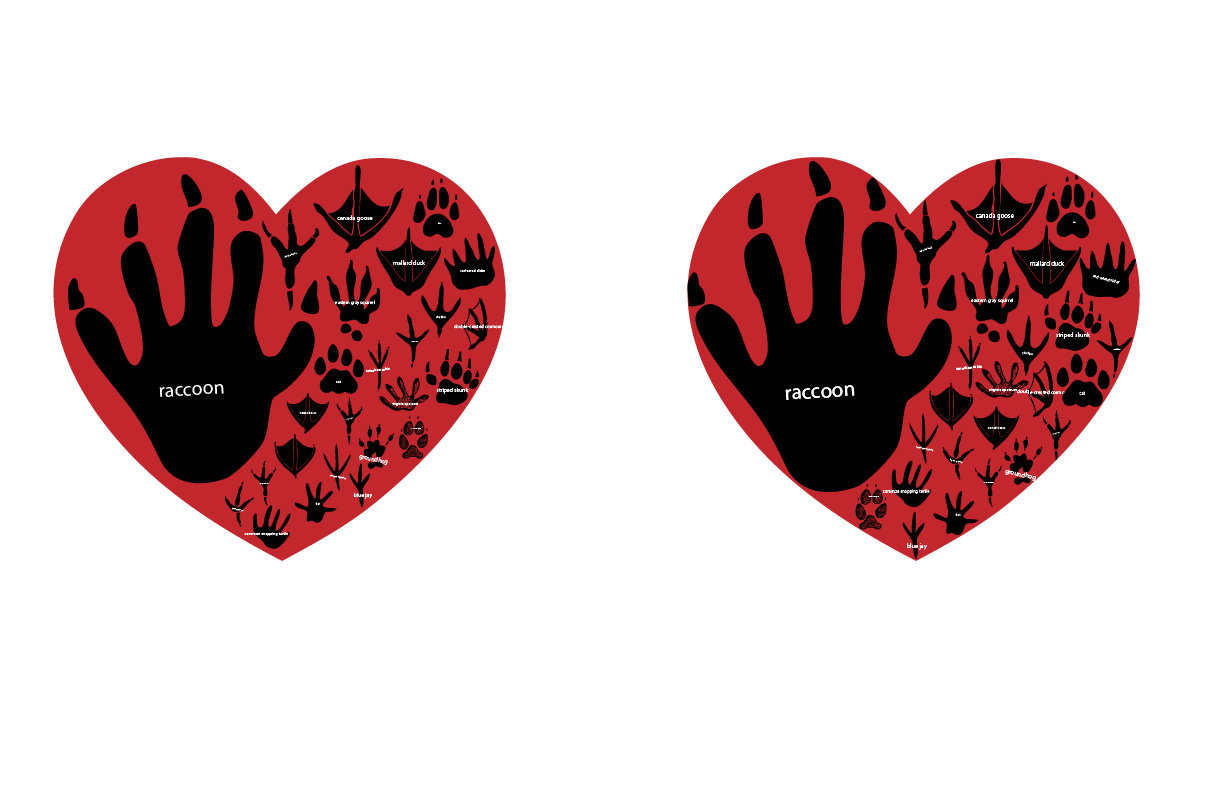
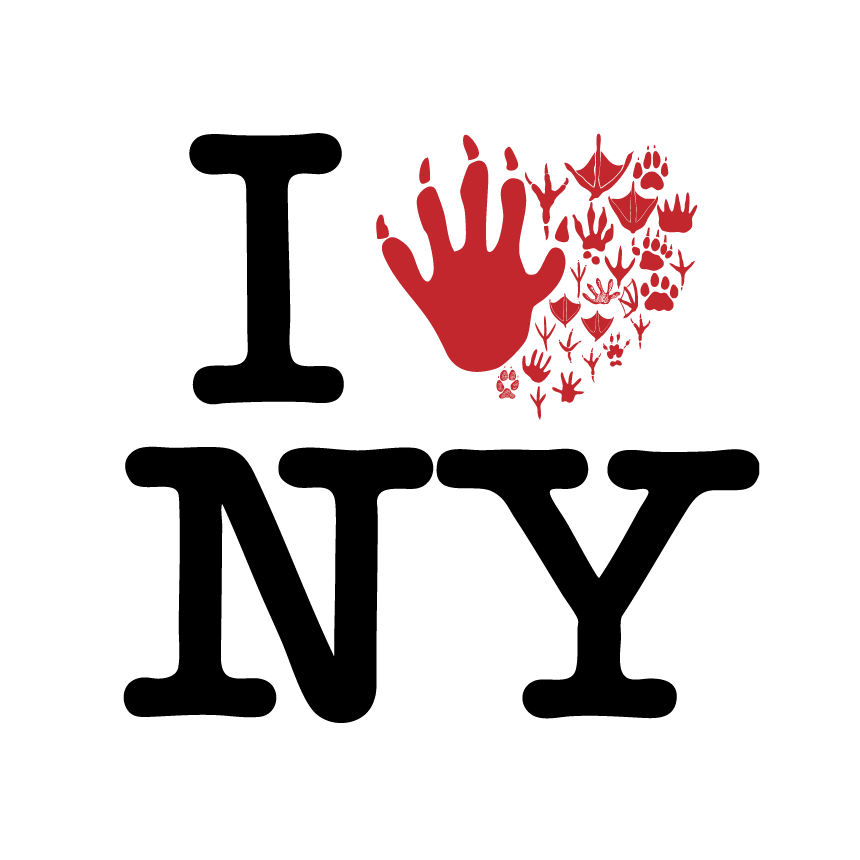
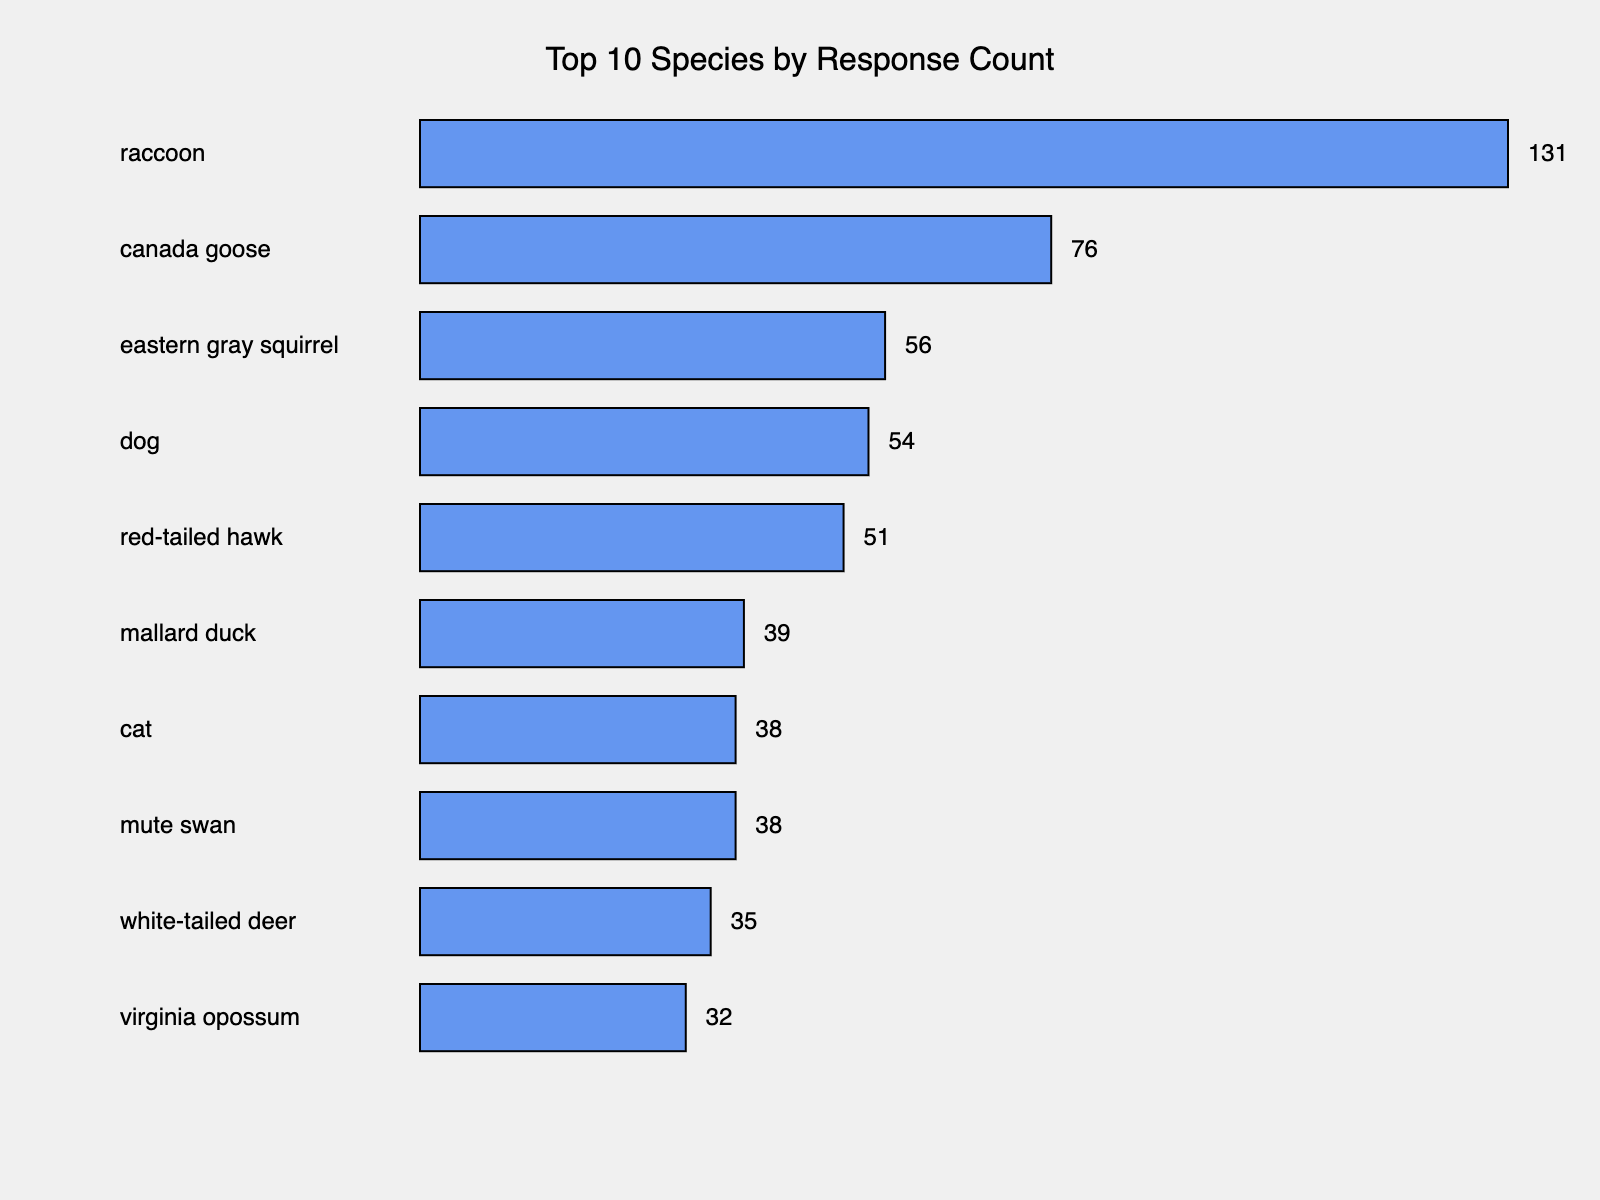
This week, in my project, I❤️NY ANIMALS, I updated my data from Manhattan to include all data from the entire city of New York. I also reconsidered the color scheme and data explanations, ultimately updating the layout and using Reso Printing and yellow paper for a simple and elegant visual.
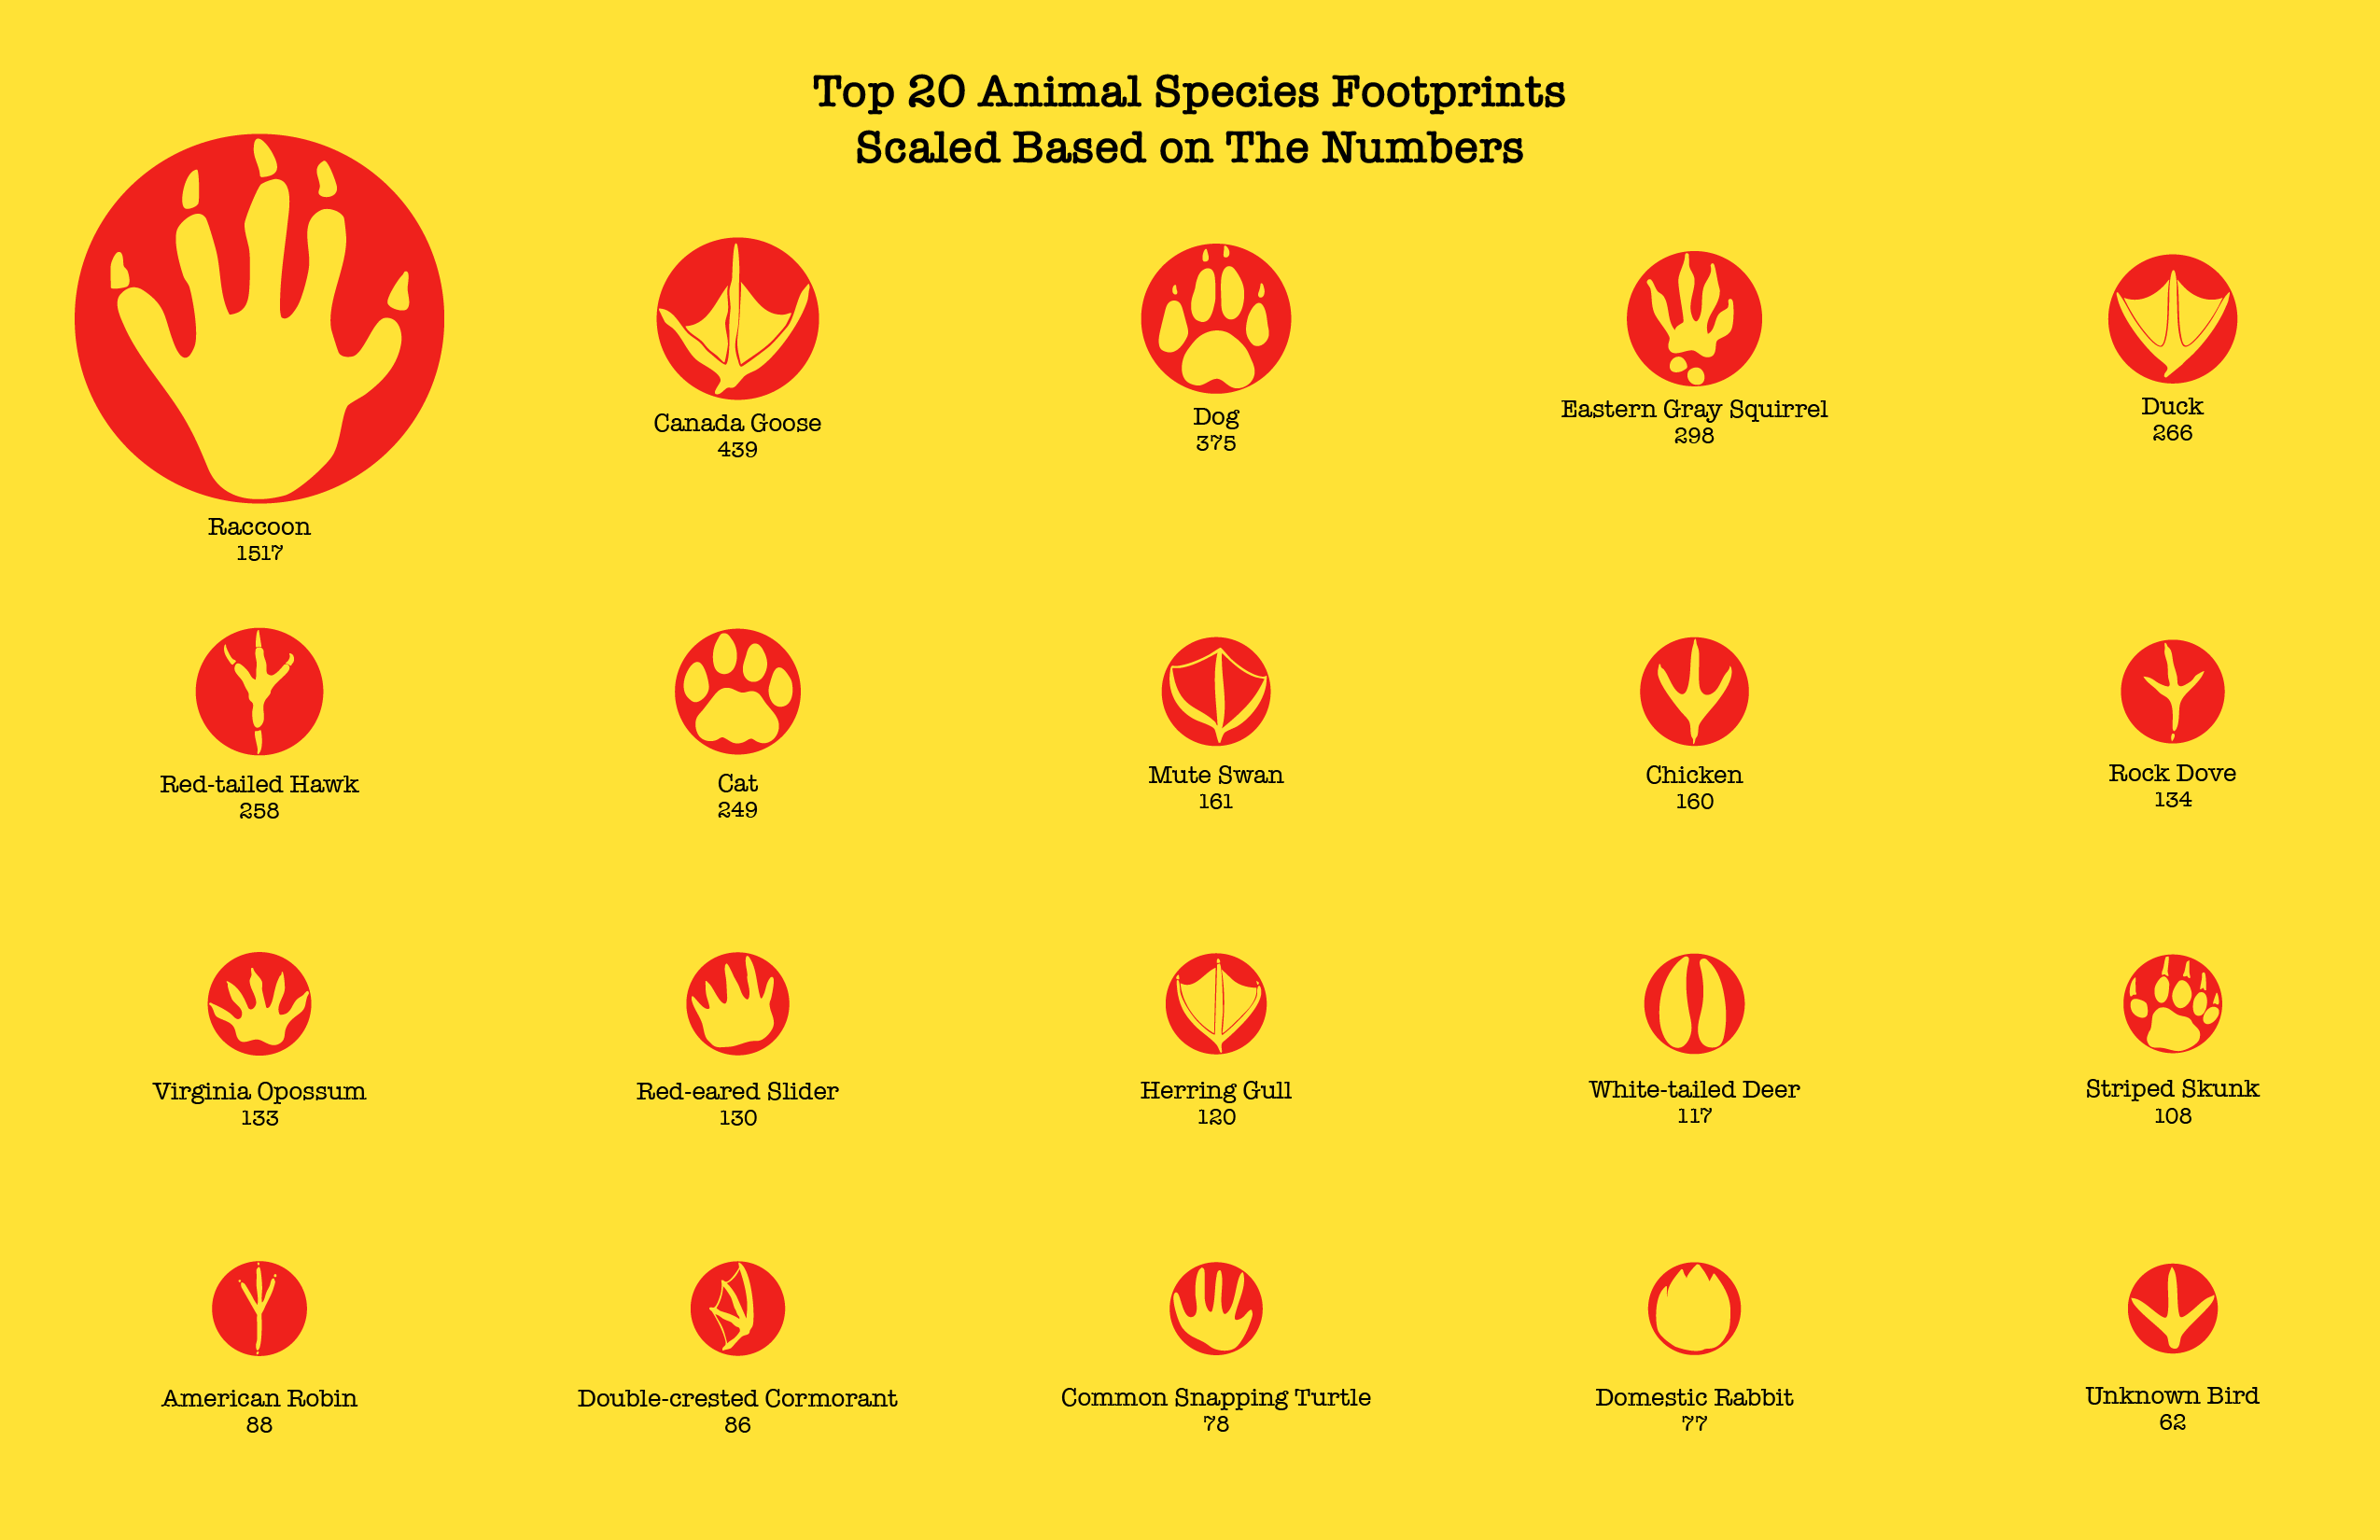
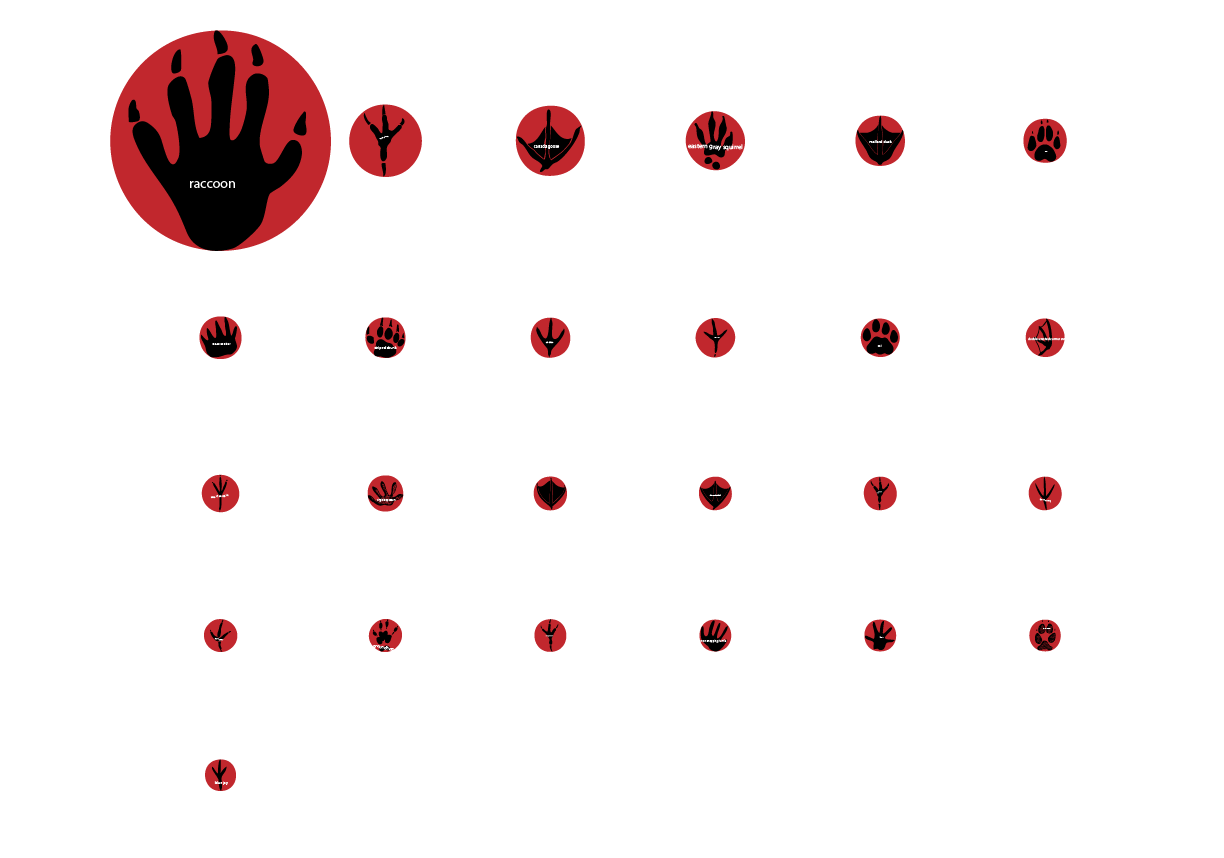
Regarding the data explanations, I considered how to use my legends to visually tell a story. I decided to include silhouettes of the animals and their basic information, even though the individual animal details are a bit lengthy. For animal enthusiasts genuinely interested in learning more about animals, I felt it was essential. My thinking is that the choice to read is up to the audience, but for designers who want to convey this message, providing it is a bare minimum.
For presentation, I initially considered using 3D printing to create physical objects. However, I really liked the point made in class last week that behind every data point lies a living entity. Therefore, I felt I wanted to express animals more vibrantly. I want to emphasize that data presentation doesn't always have to be so "technological," so I thought of using hand-carved stamps. The stamp also provides opportunities for audiences to participate and guess the animals.