Week 13
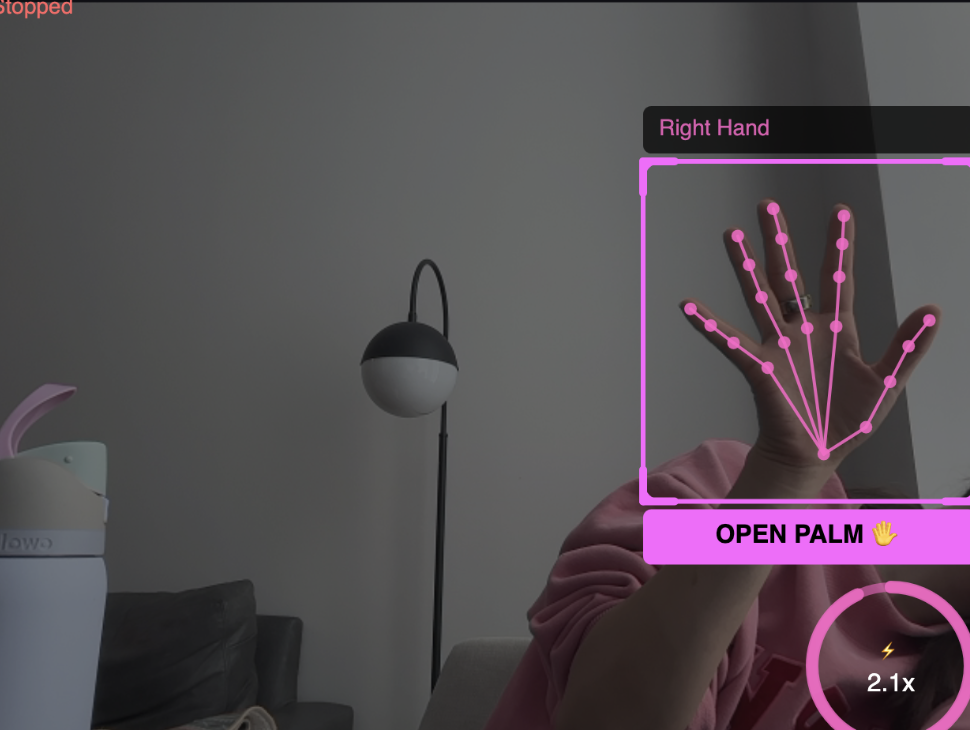
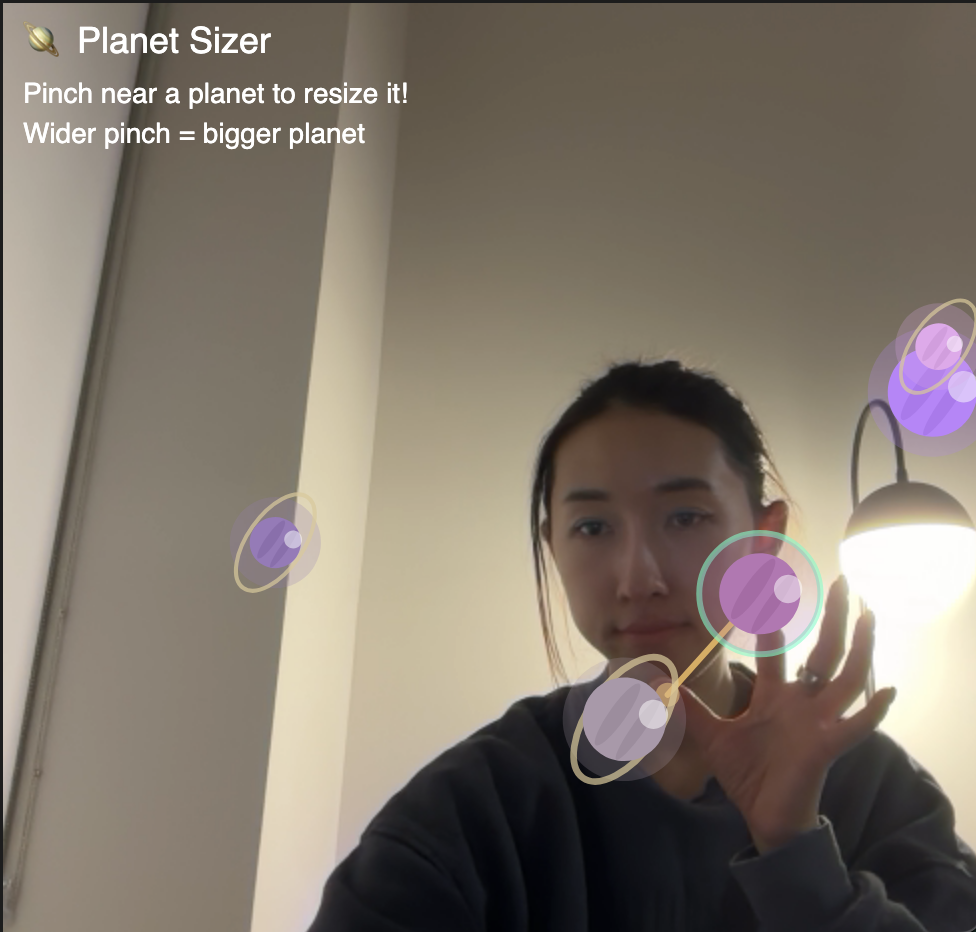
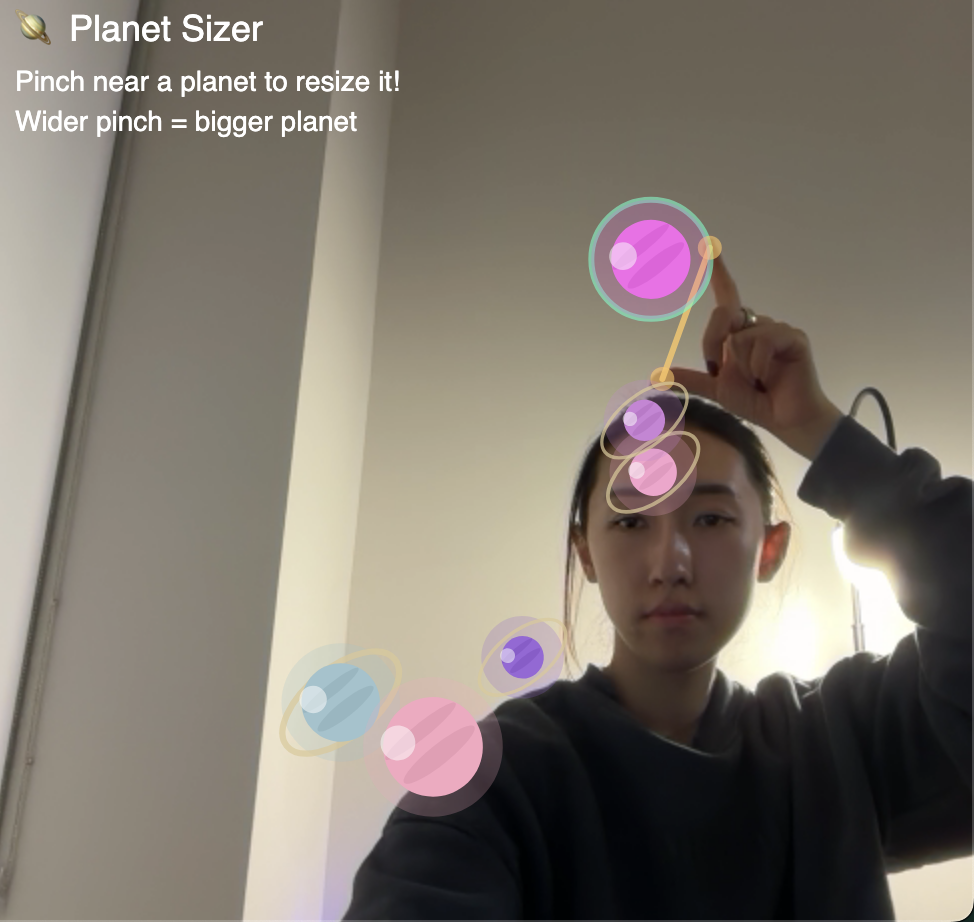
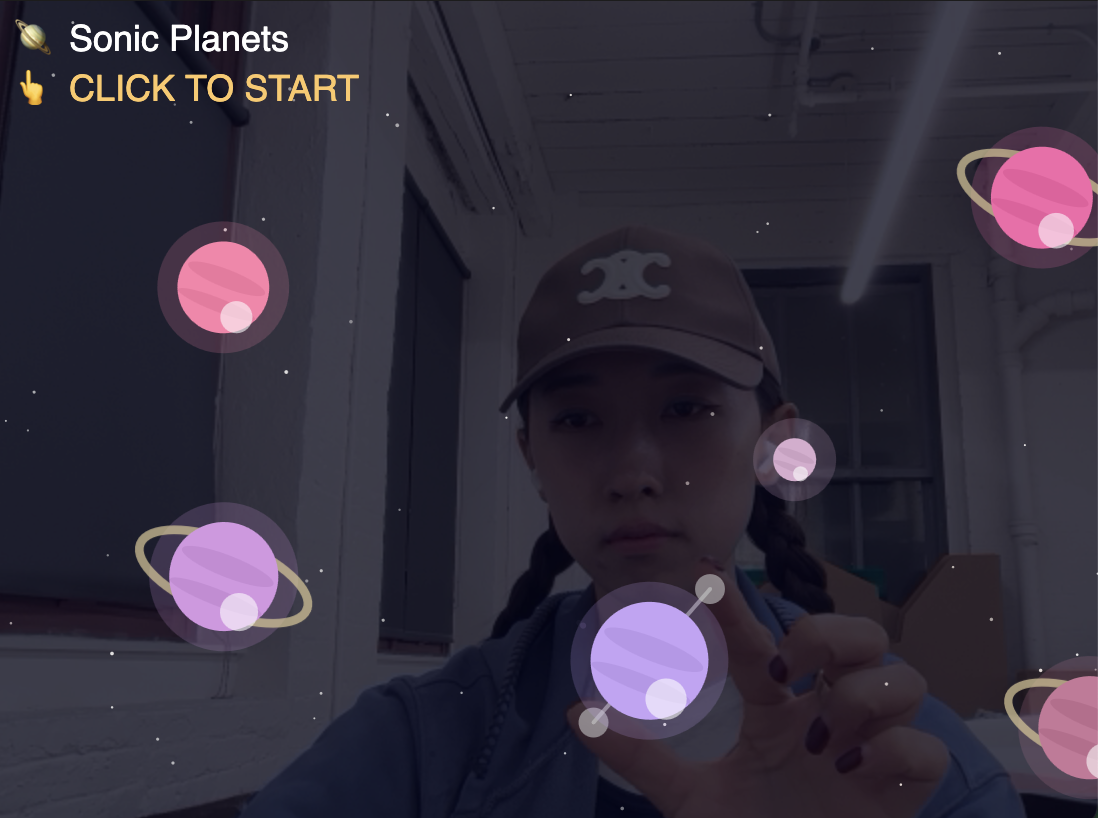
This project is an interactive, code-based experience centered on hand interaction and sound. The viewer’s hand becomes the primary interface, with gestures such as pinching, spreading, and moving triggering real-time changes in form, motion, and composition. Rather than relying on predefined objects or environments, the visuals respond directly to the hand’s presence and behavior, creating a fluid and intuitive system. Sound acts as immediate feedback, shifting in tone and intensity based on gesture and proximity, turning movement into a performative, instrument-like experience. By combining code, gesture, and sound, the project encourages exploration and transforms the viewer into an active participant shaping the work in real time.
Credits & References
Claude