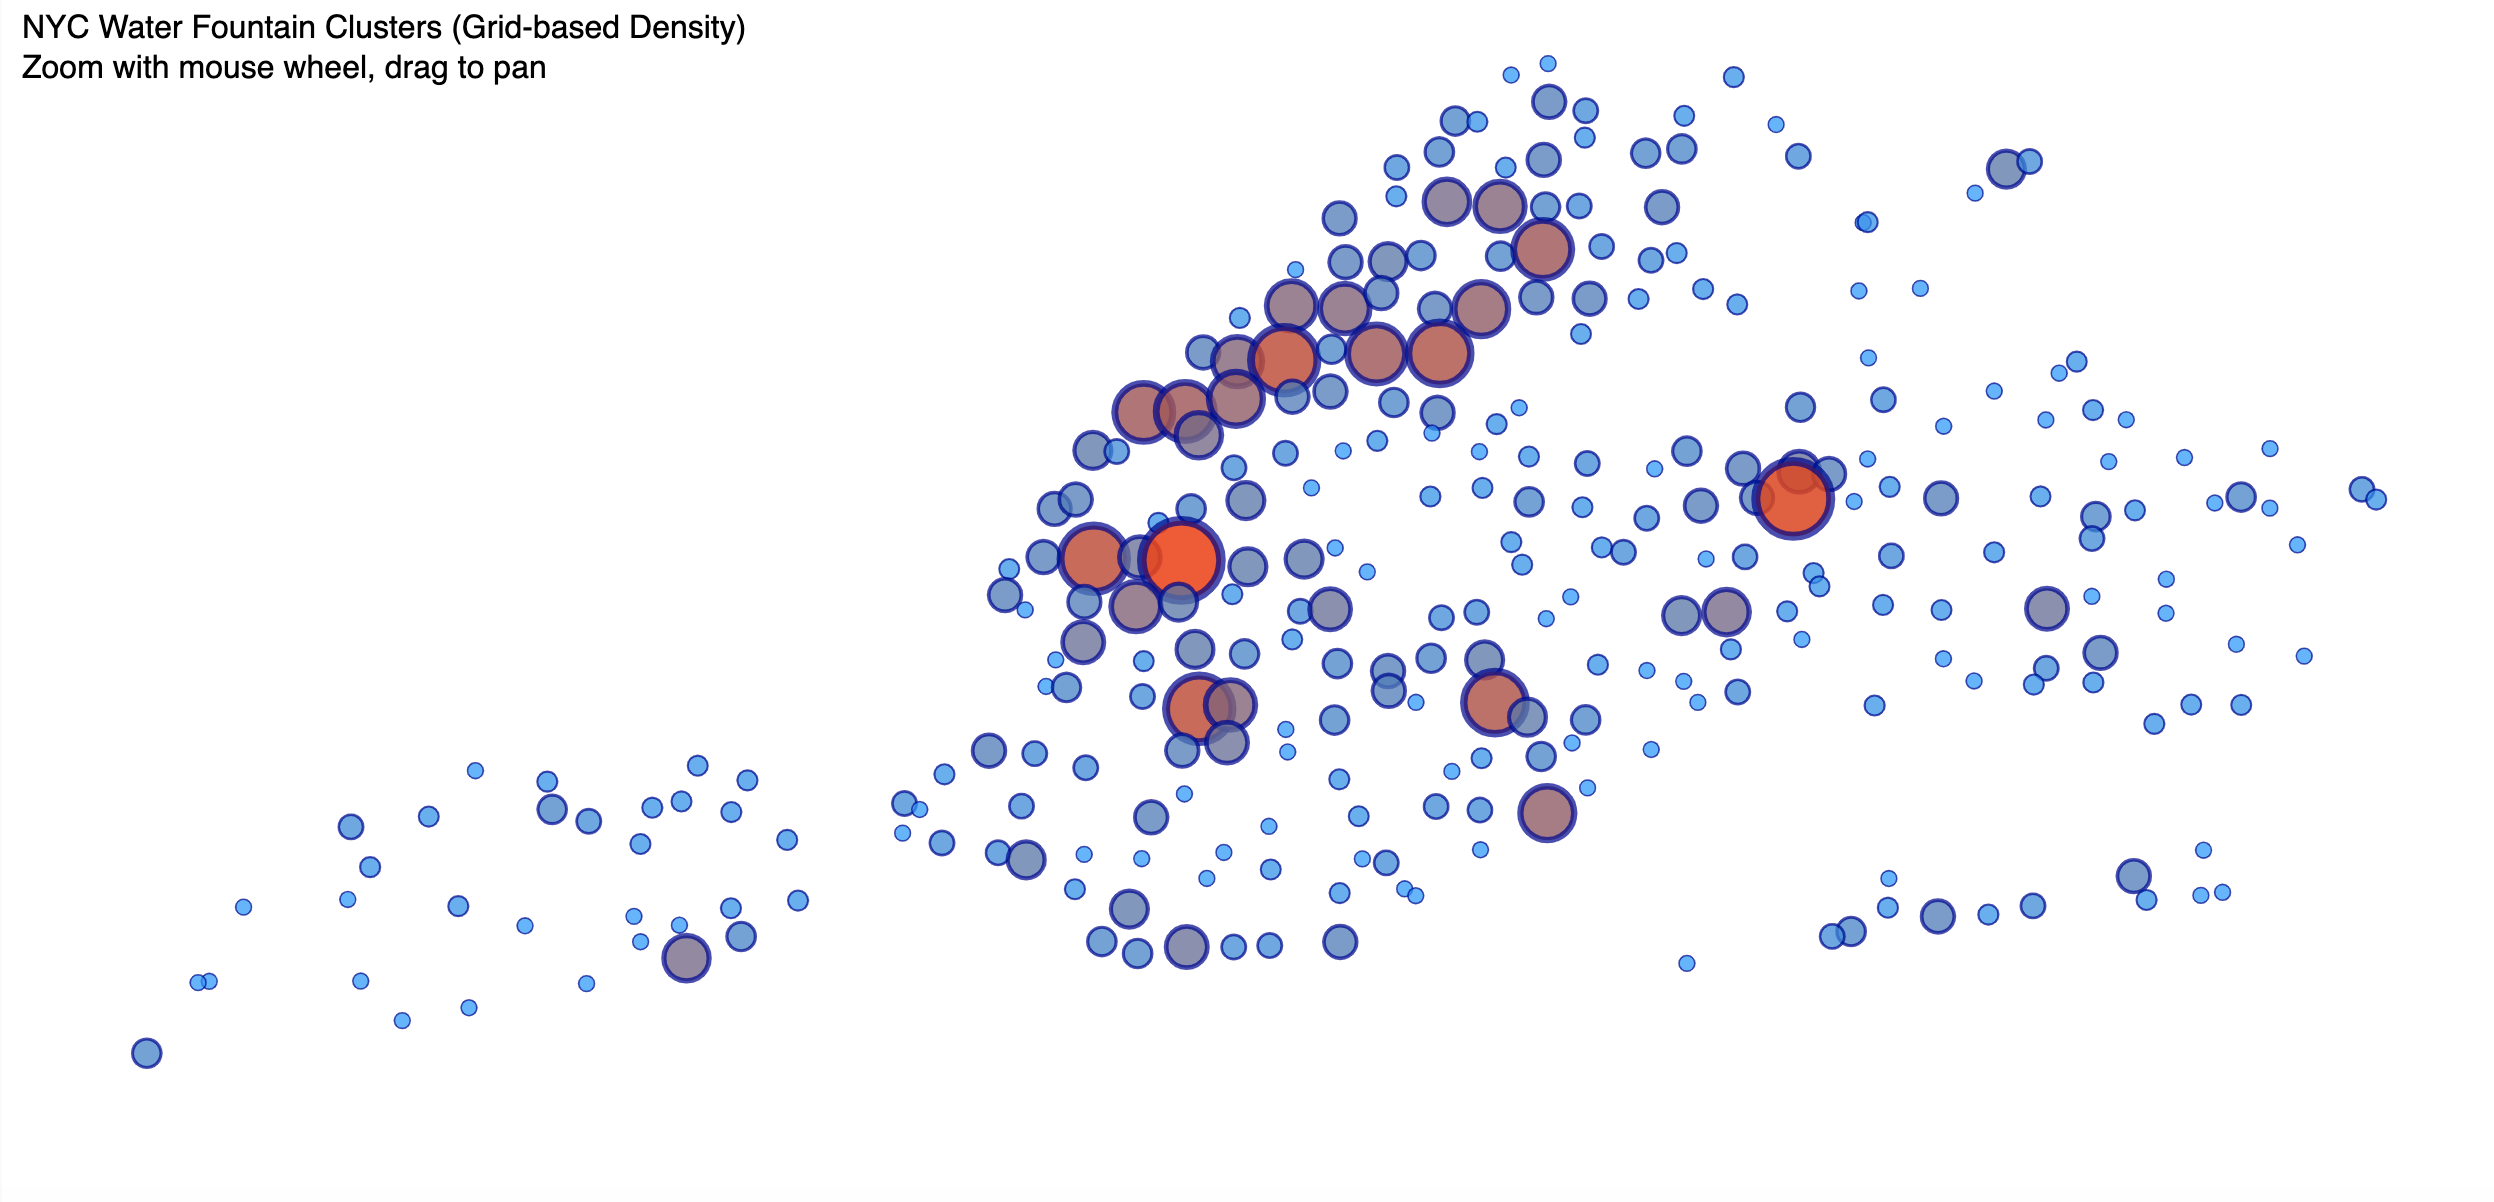
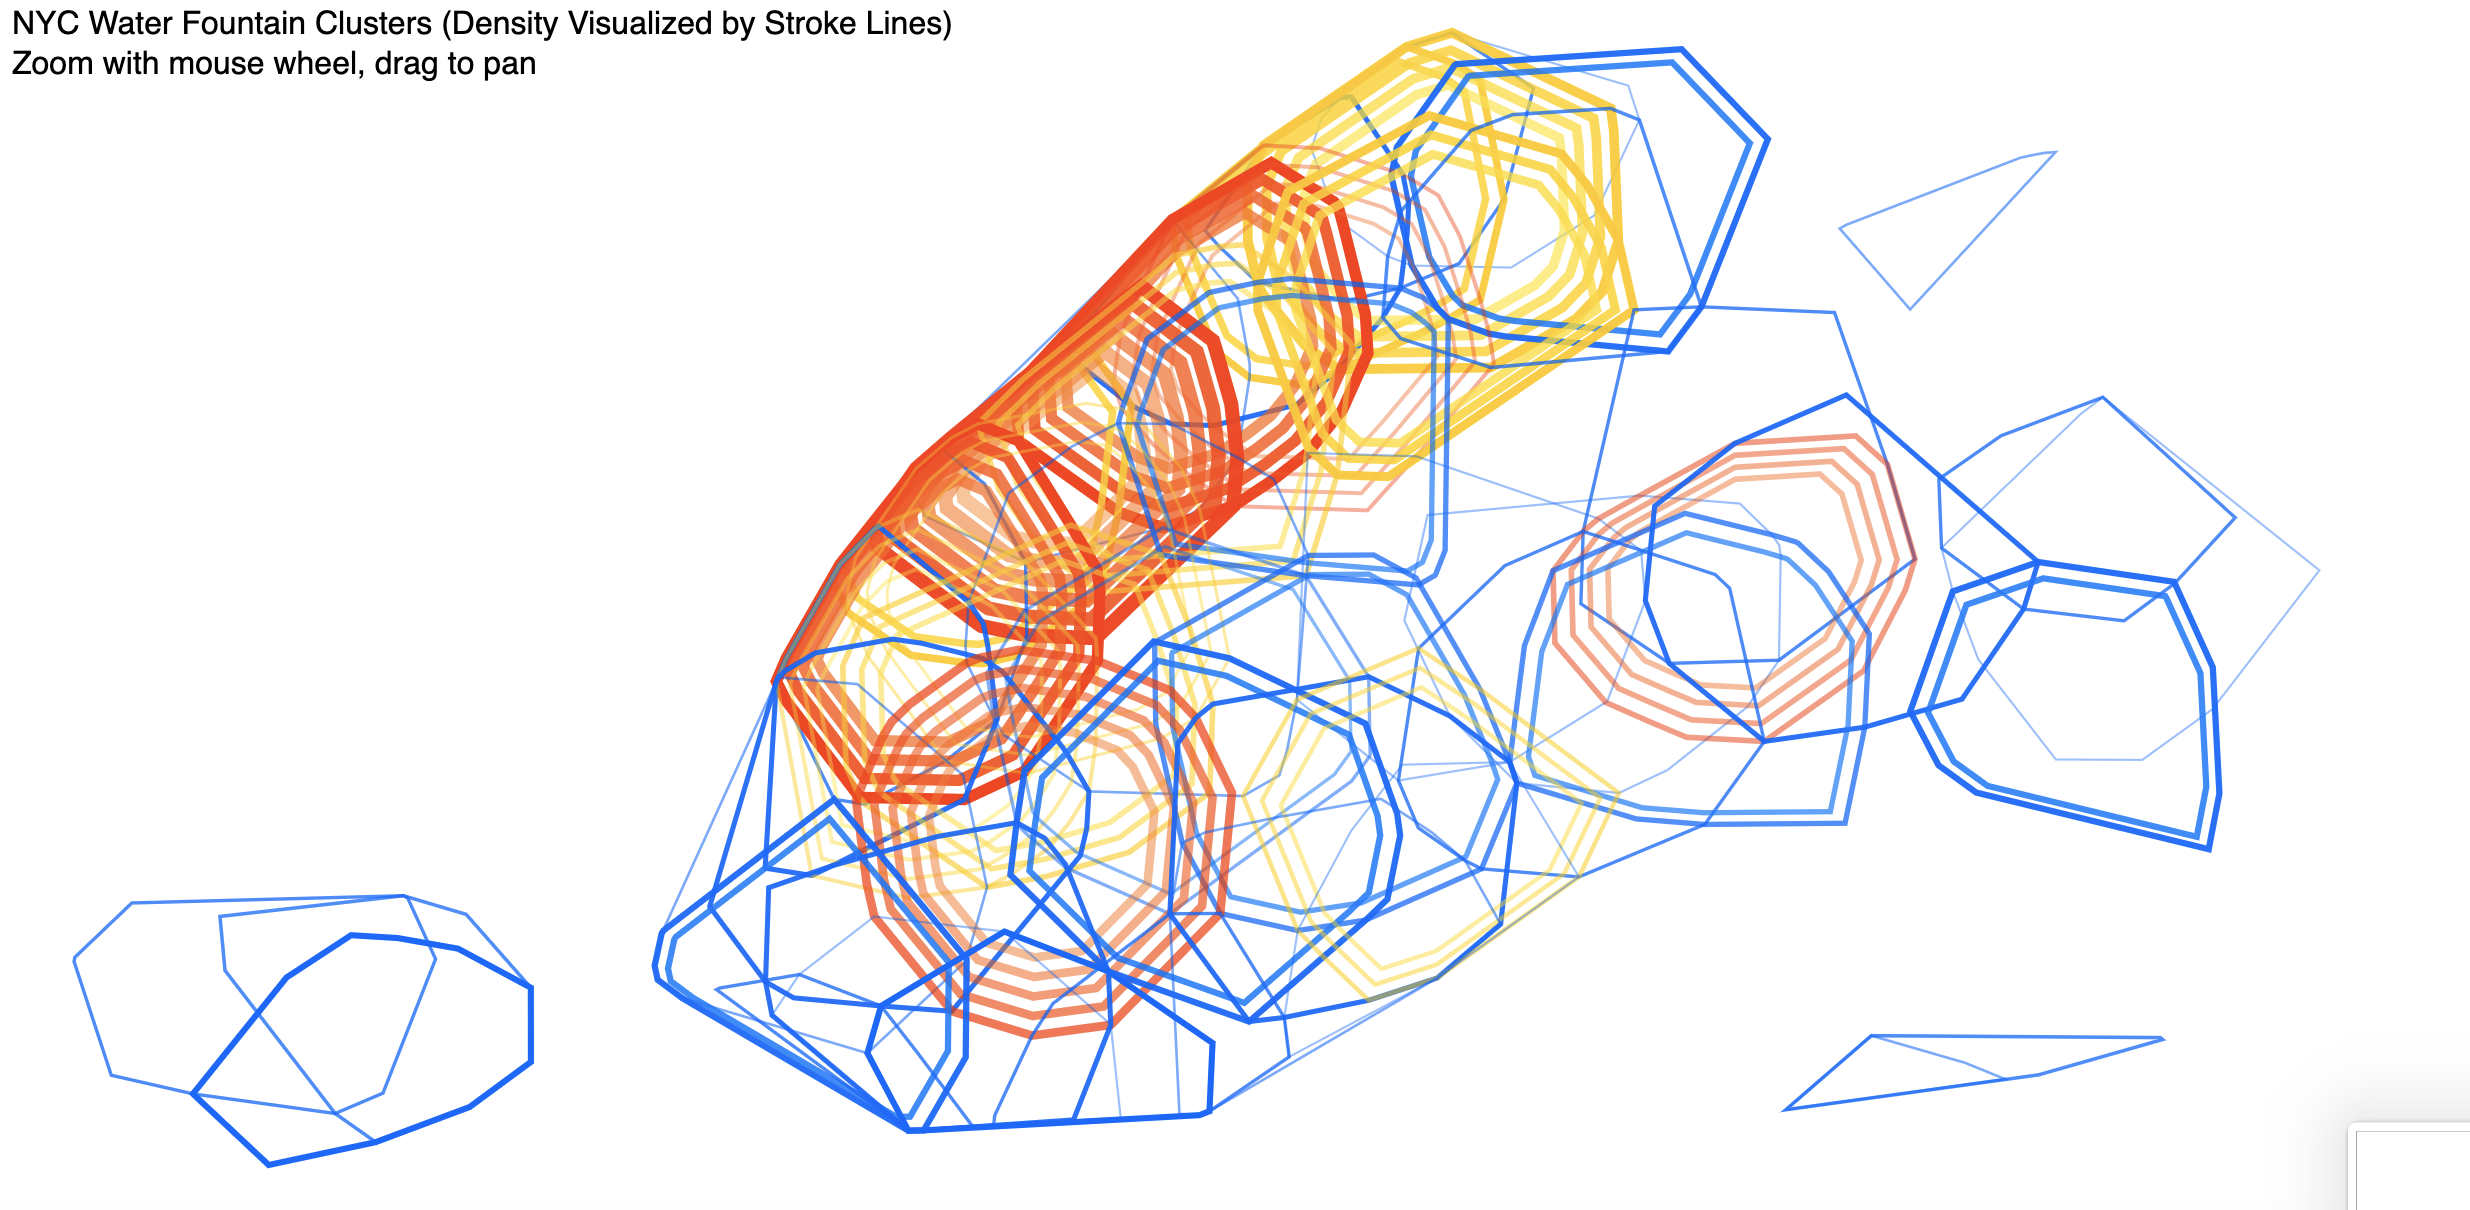
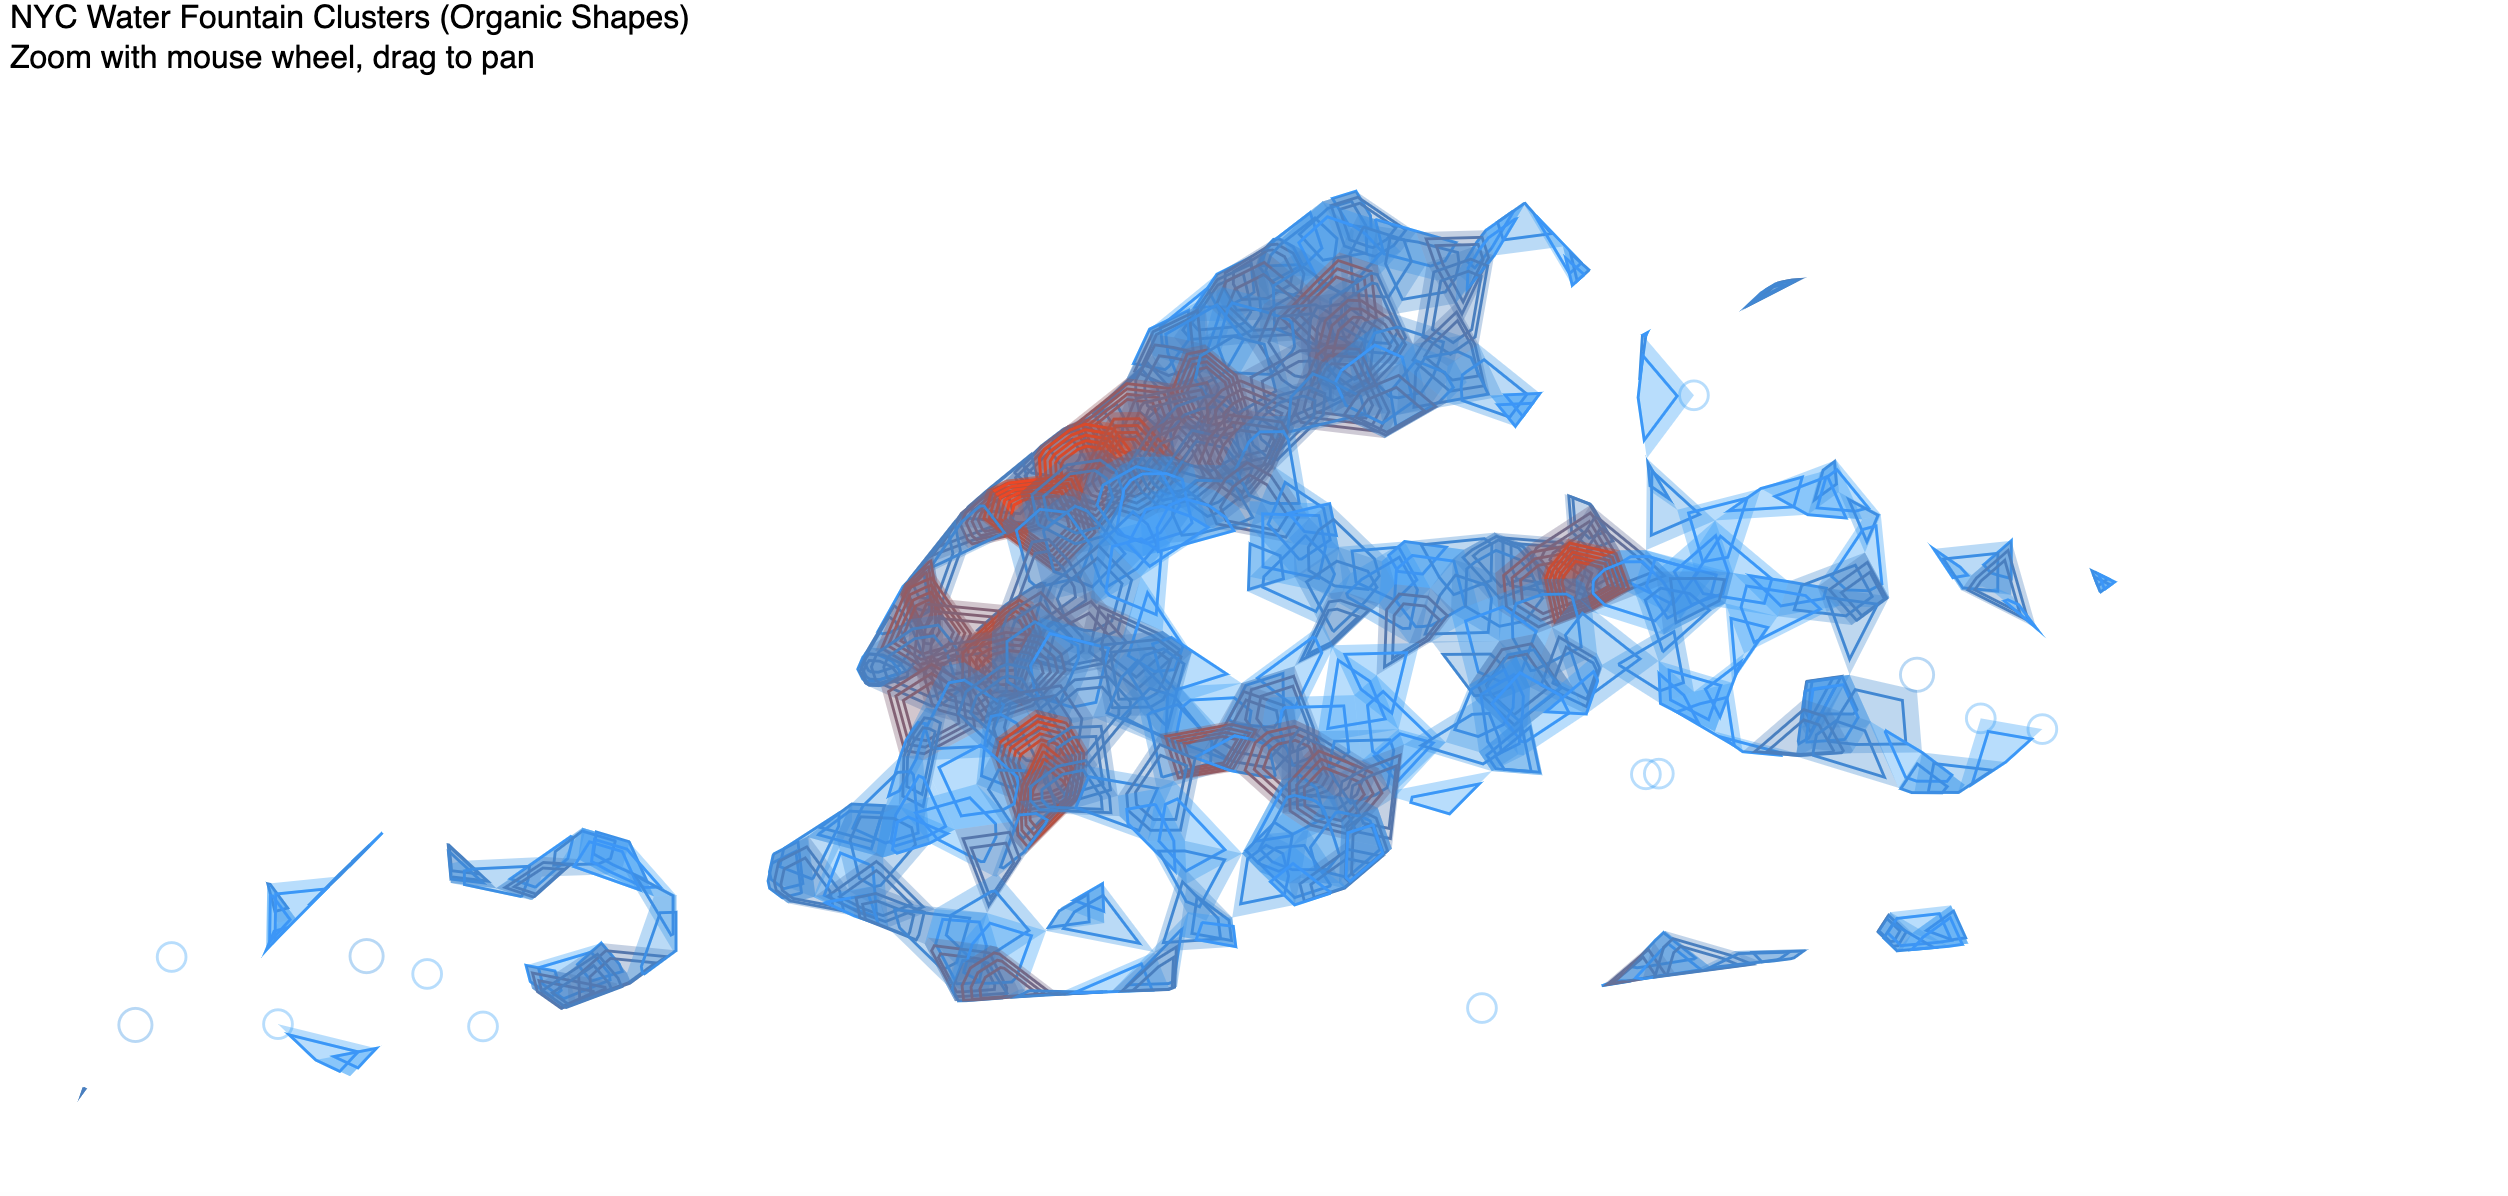
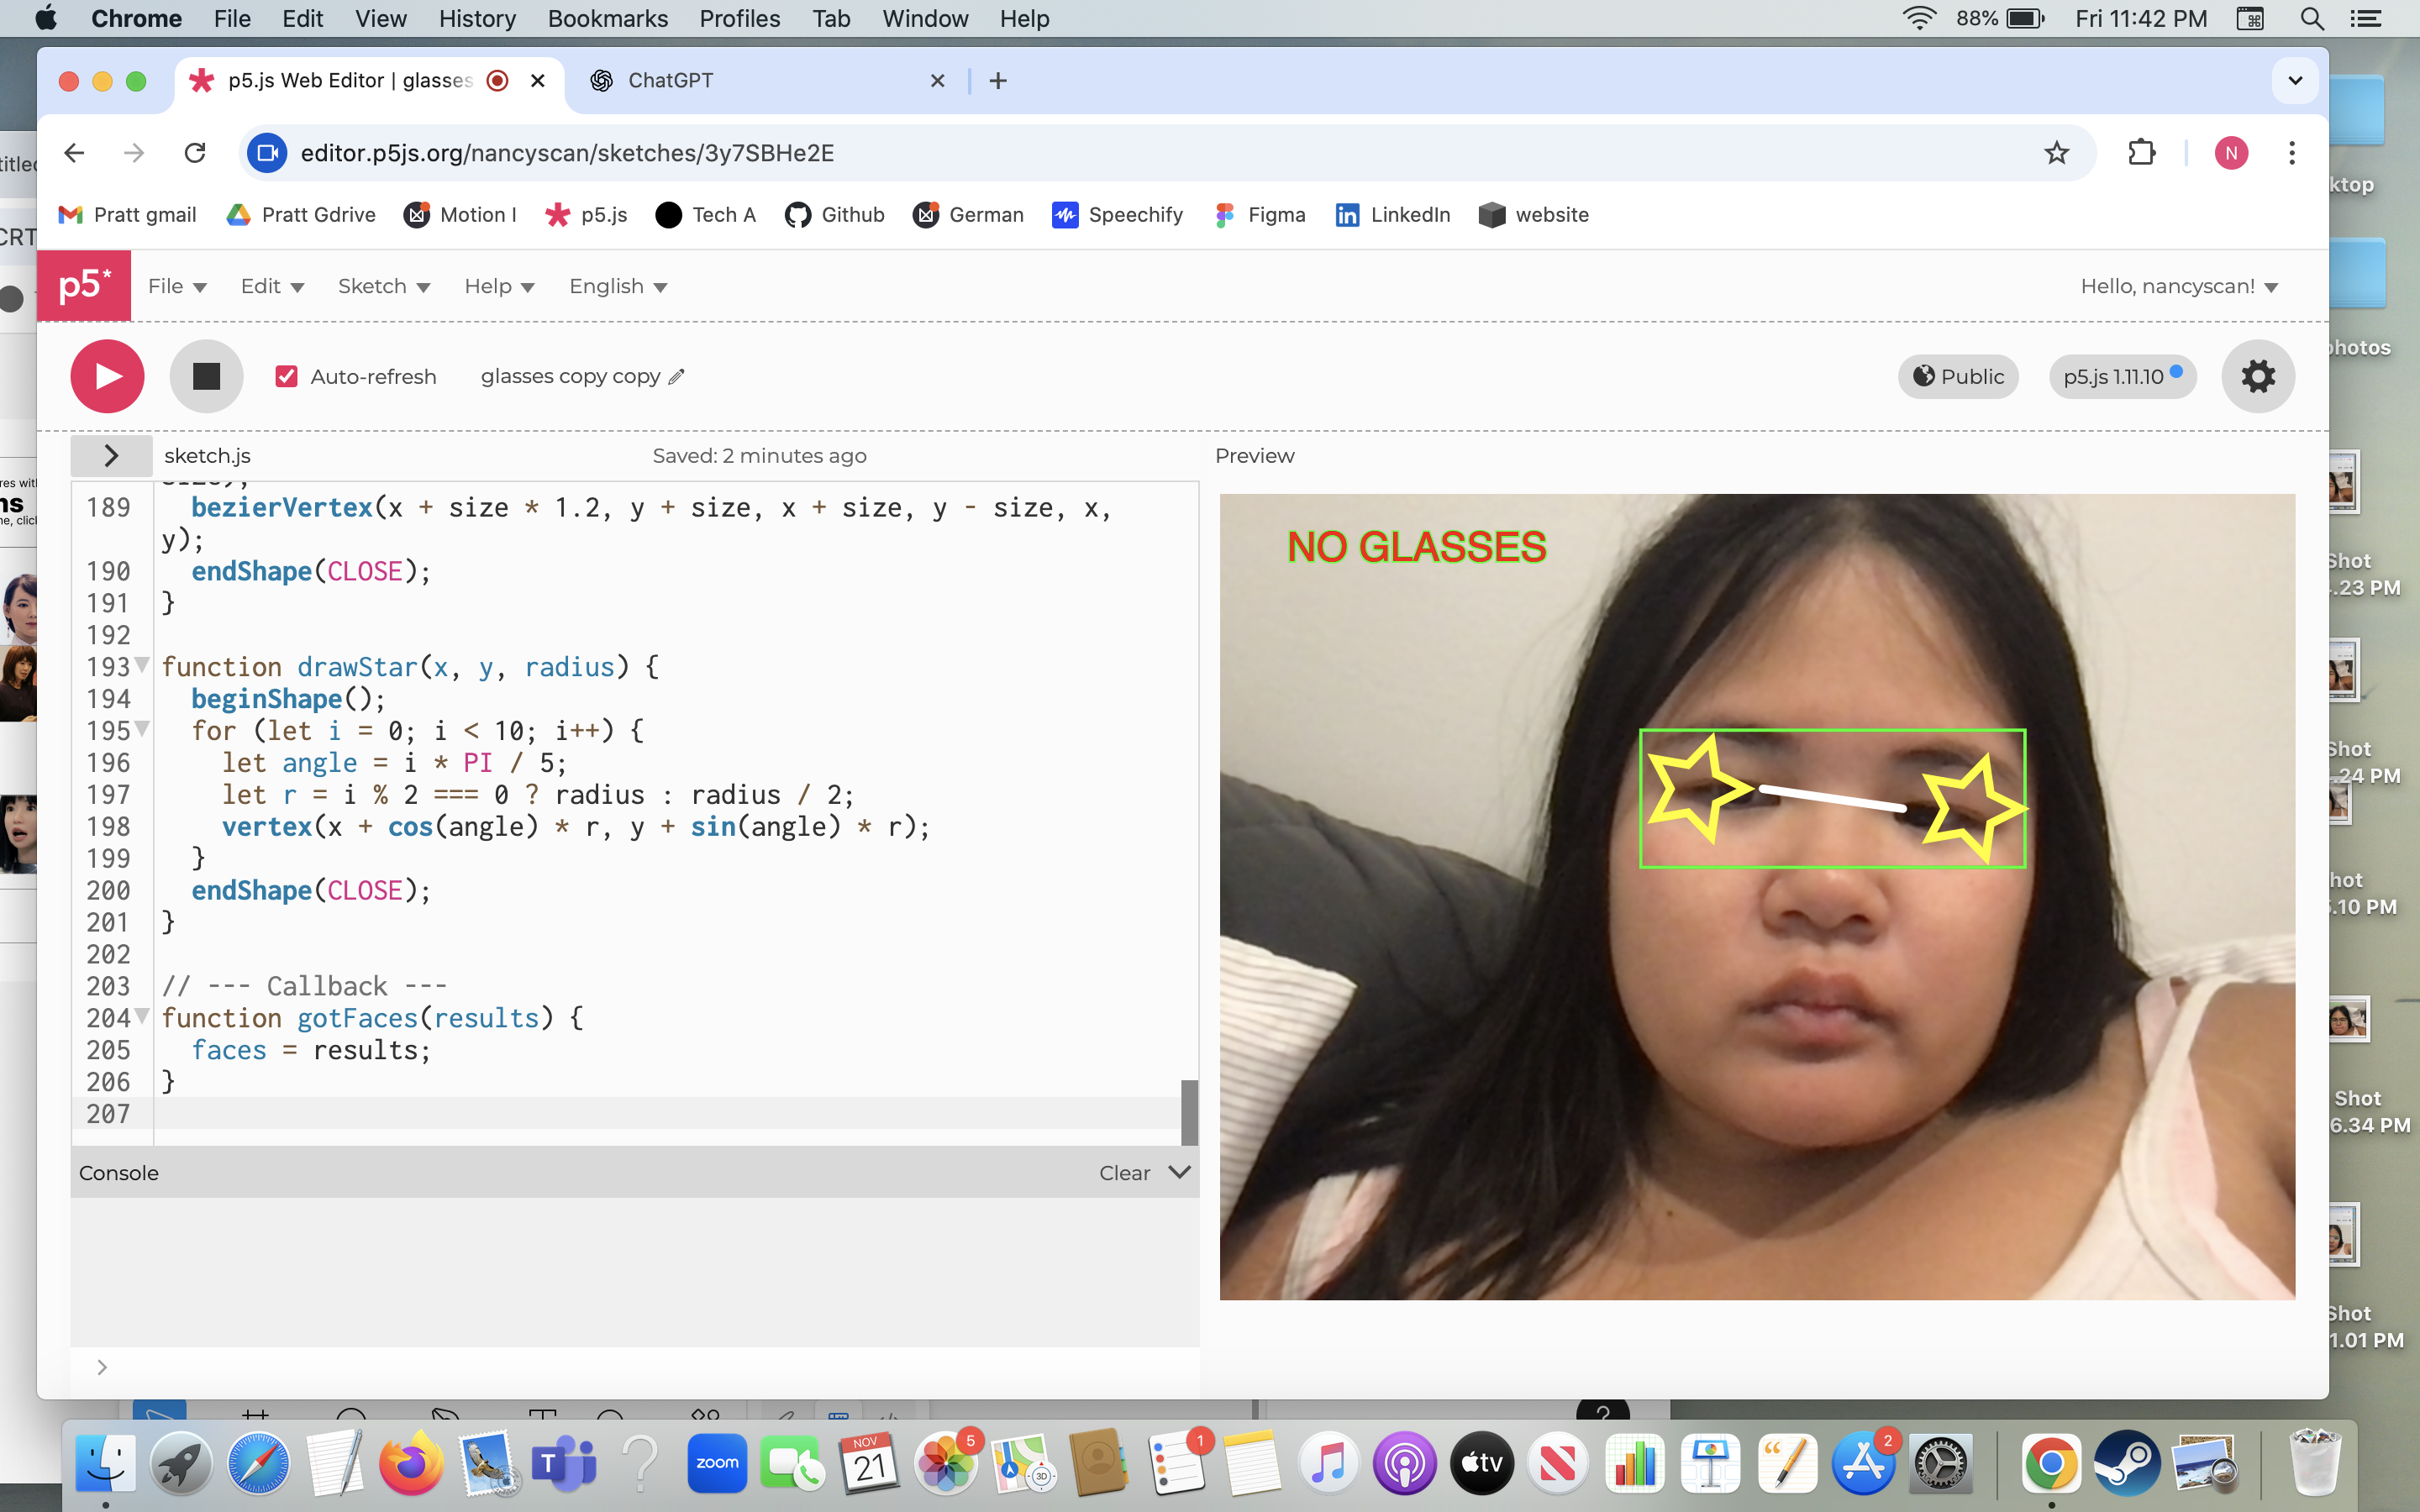
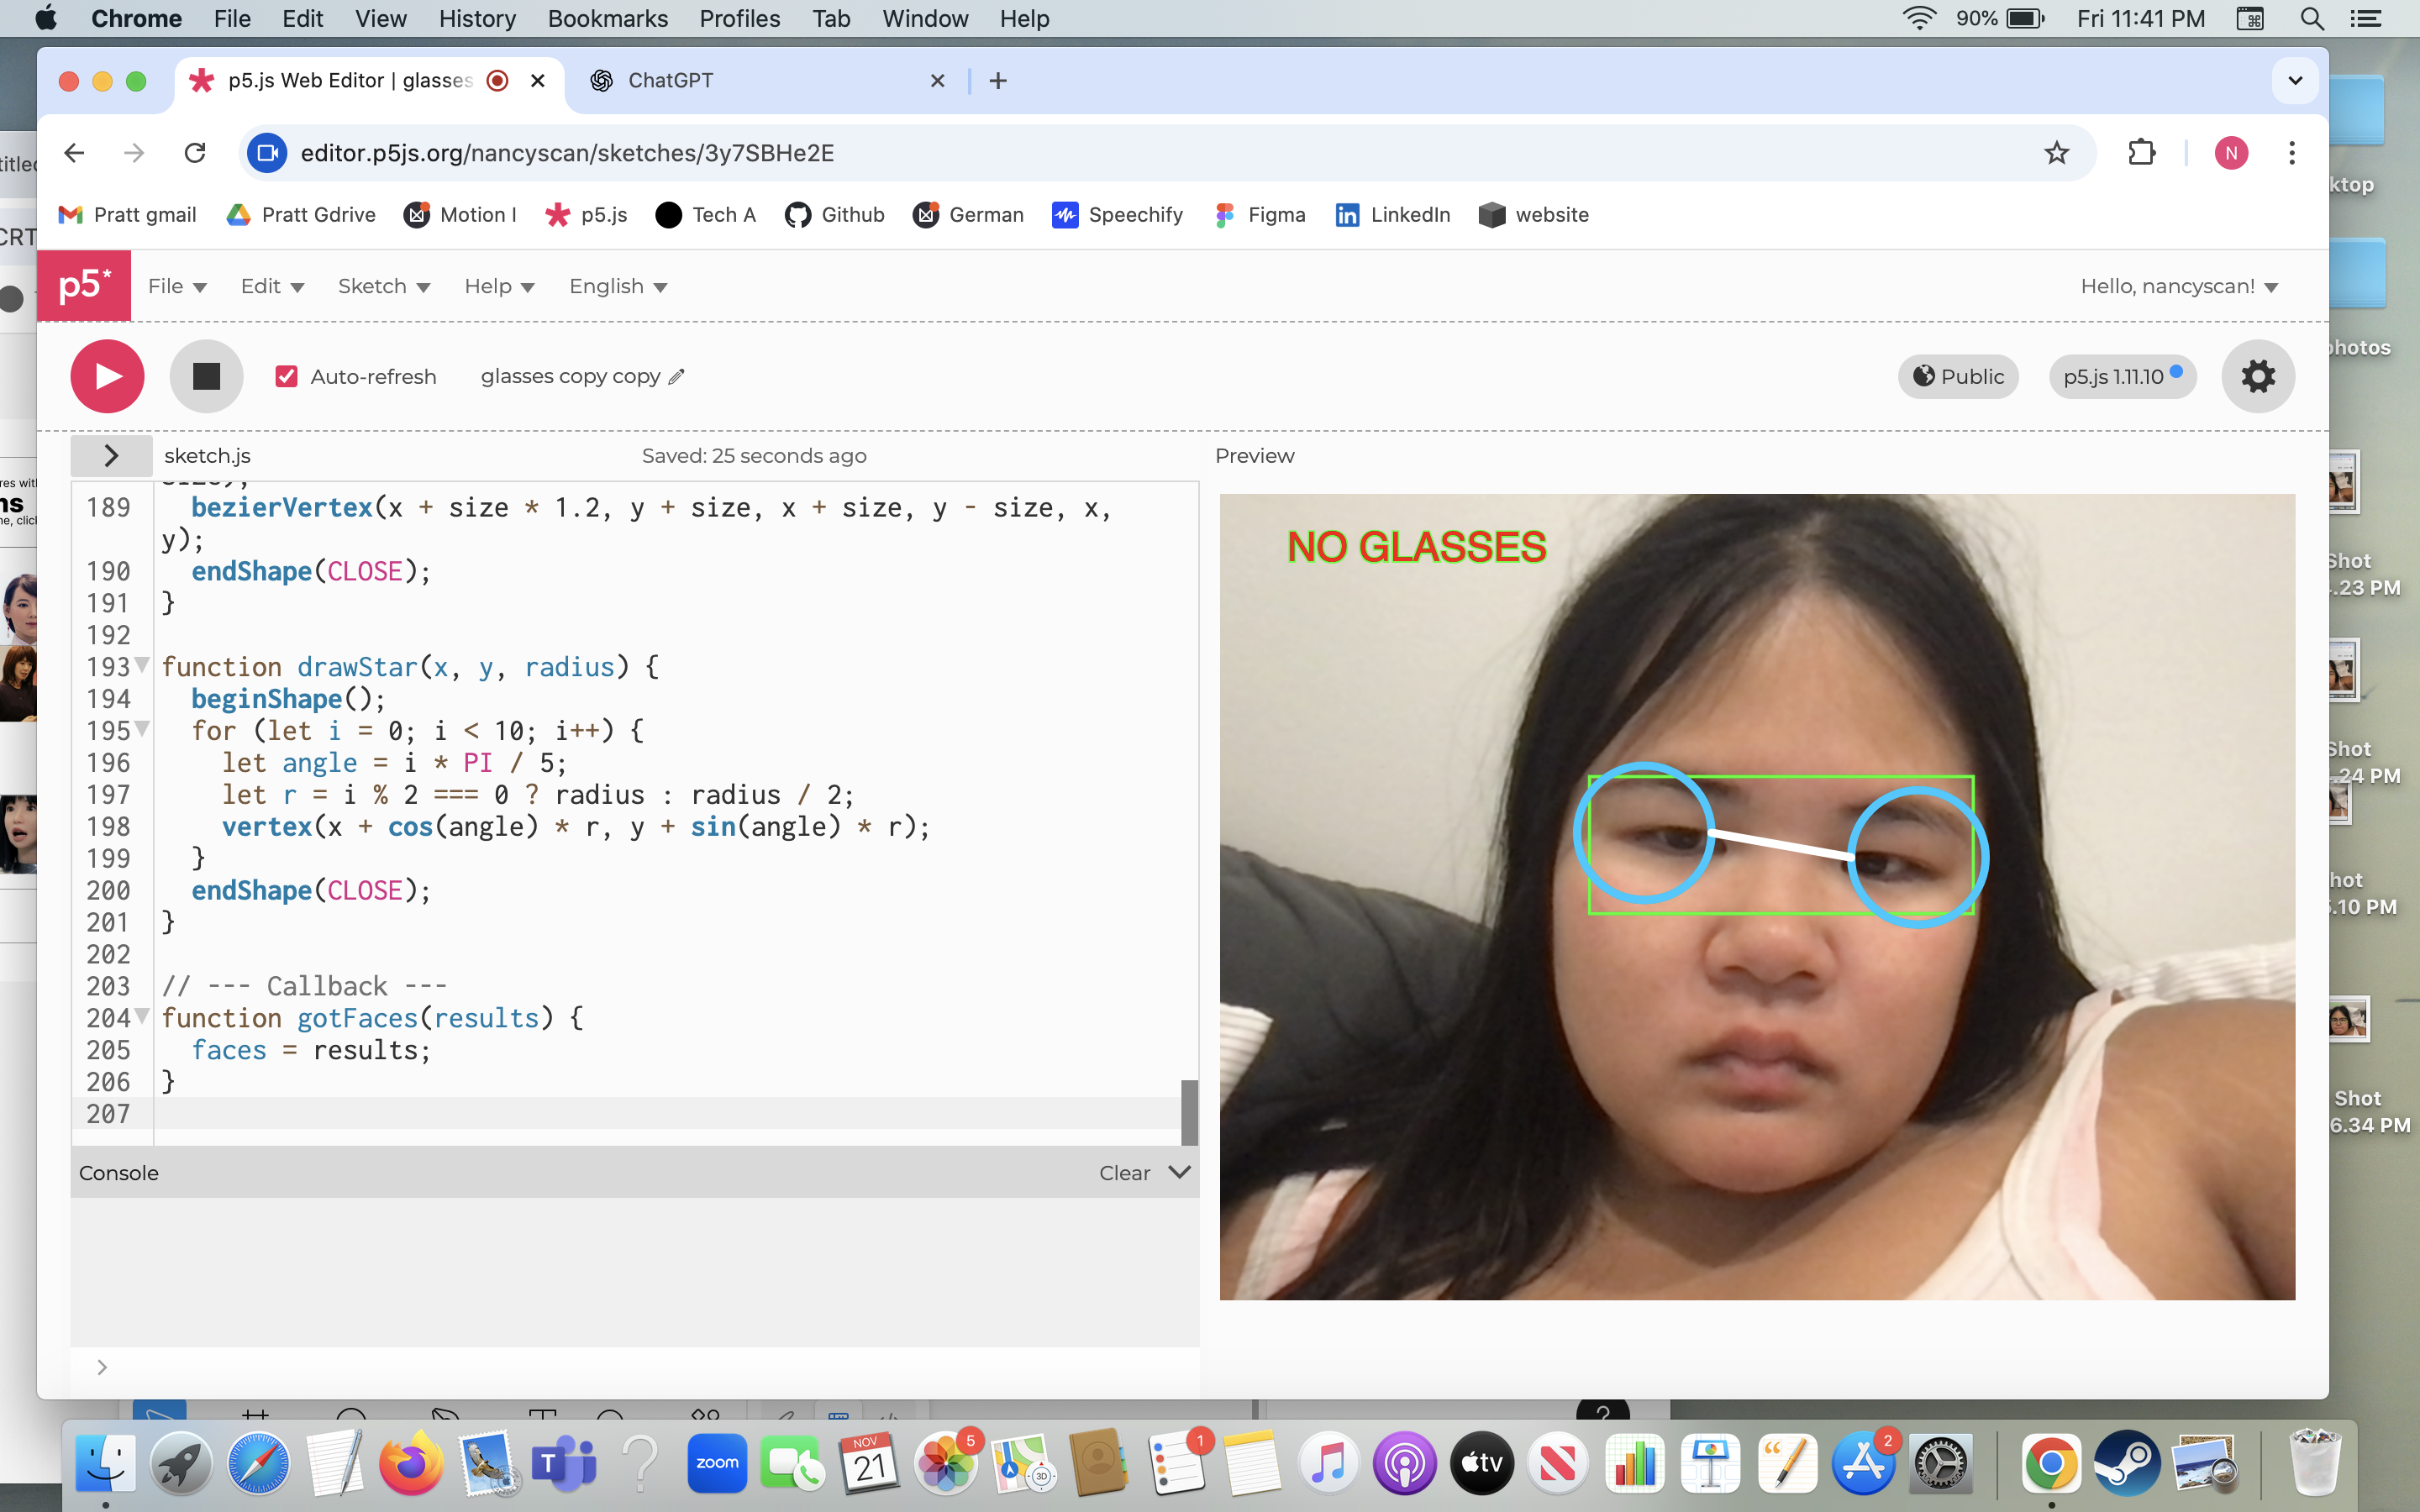
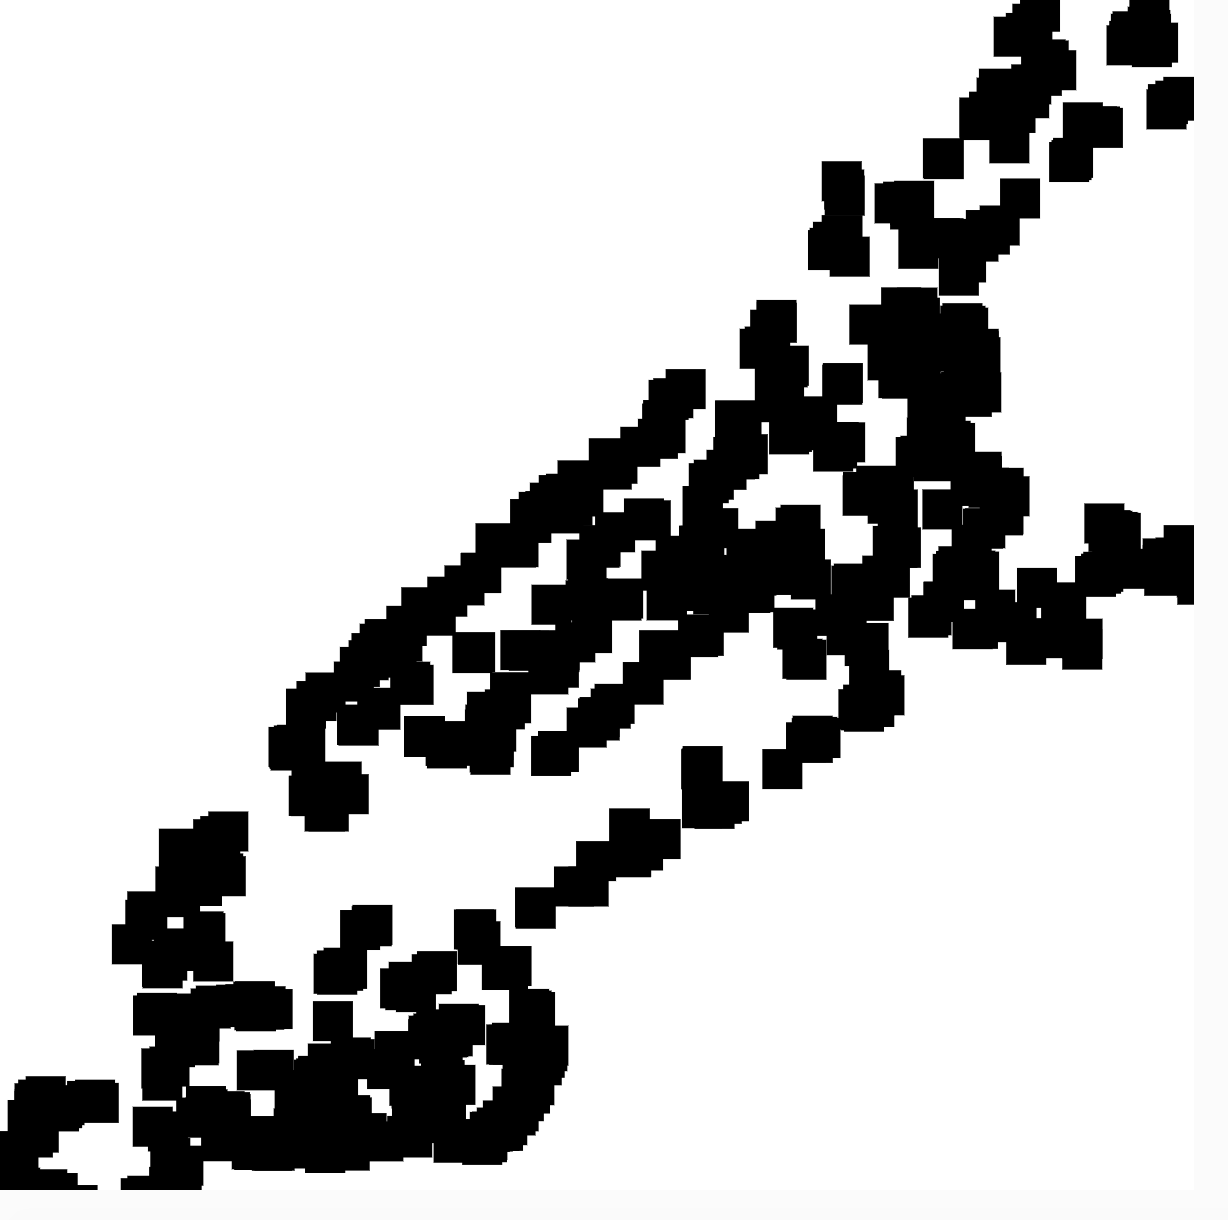
I came to the conclusion that I want to use laser cut to make a terrain of nyc. For example the wood-cut terrain models. It would be essentially a map of nyc showcasing which areas have the highest density, middle density and lowest density. I have a specific idea of a heat map in my head to reflect a design in p5.js but it is challenging. I want a custom vector shape to represent an area of high density and so on. If I have the chance I will add lines growing inward to show that it has the highest density,, Lesser lines for the lower density.
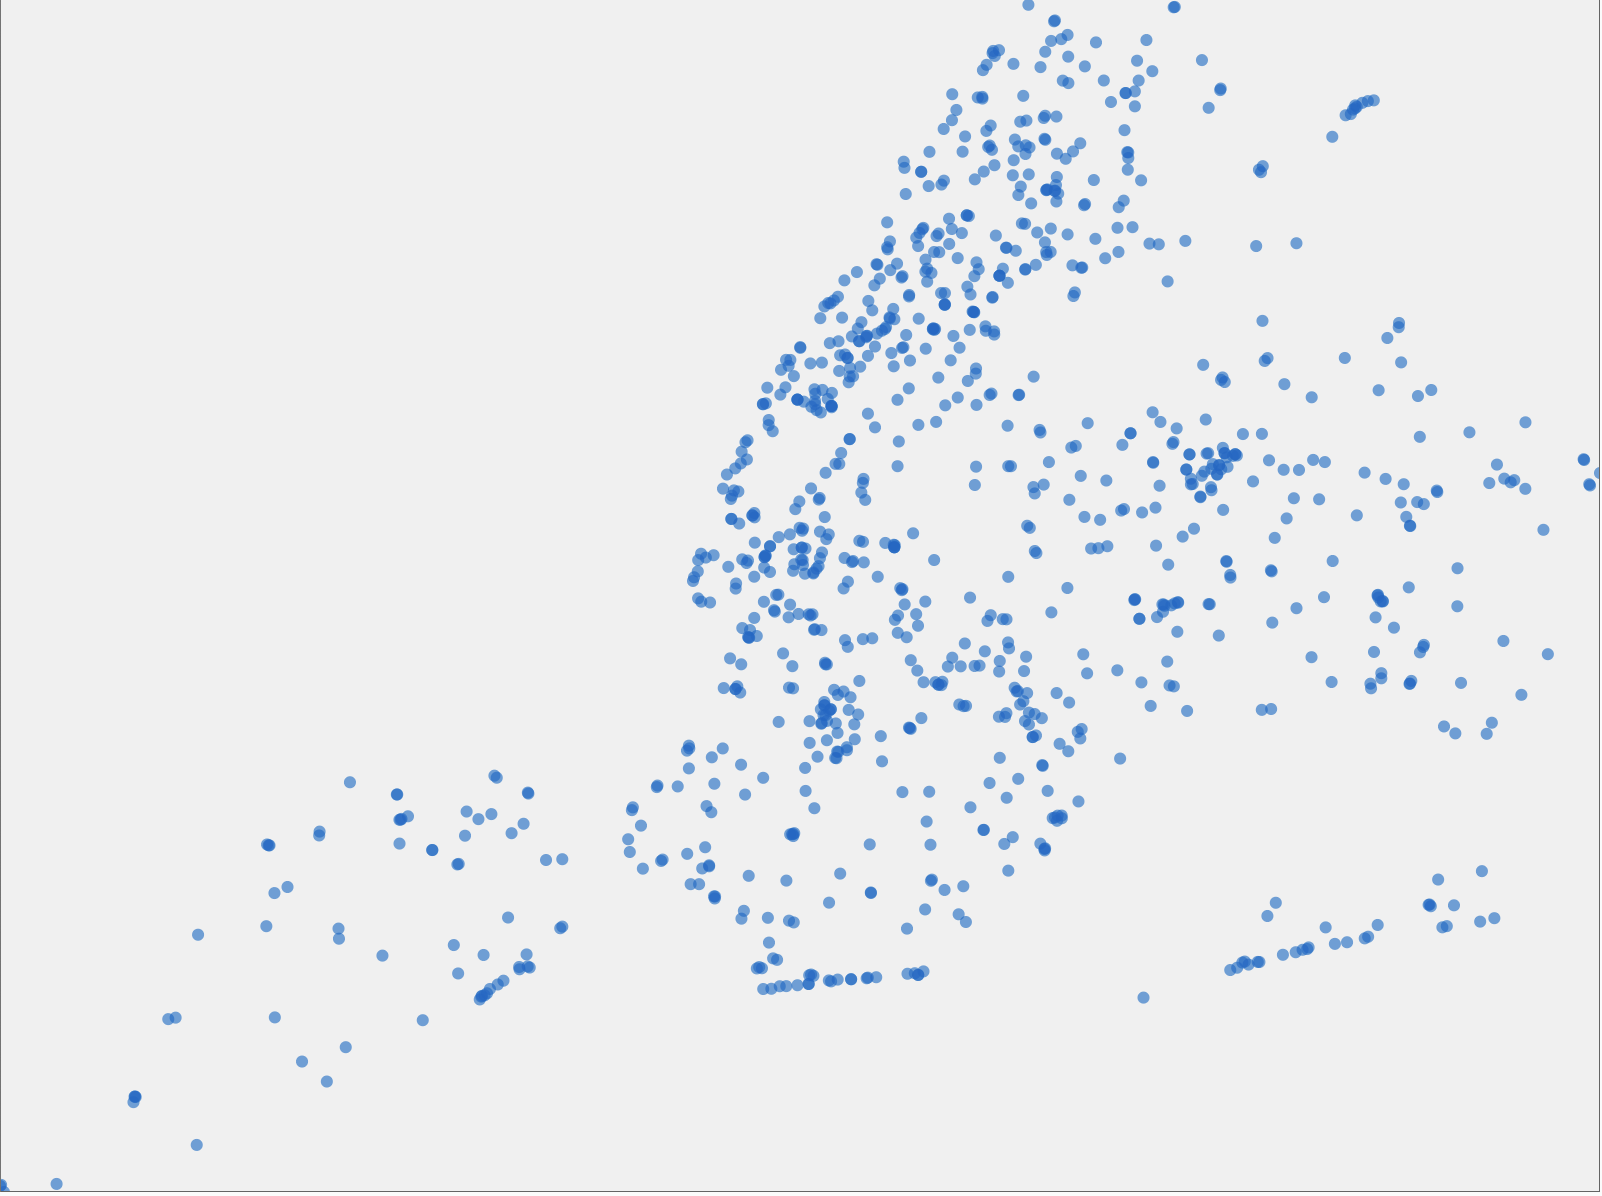
I found this good tutorial or p5.js file but it was html. It was because it is a Leaflet. So i'm wondering how I can change that into vector shapes. But I think I did okay to replicate what I work or closer to what I want to achieve.