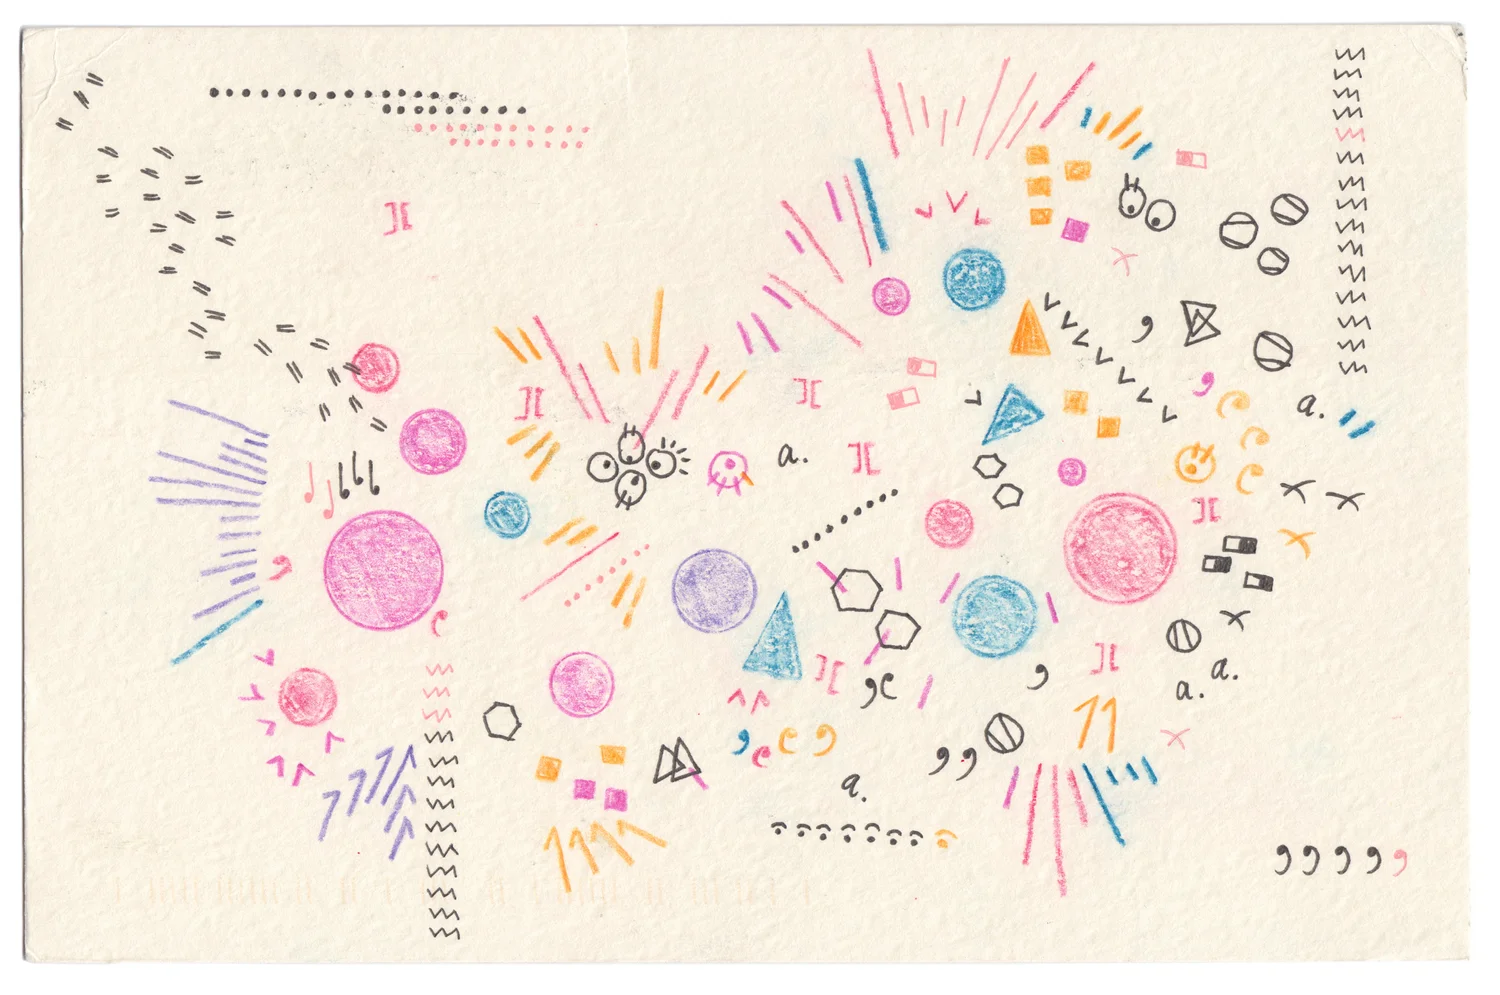
Graduate Studio: Technology A [Class Notebook] (DES-720A-02)

Week 6: Data & Mapping Data

This week we are exploring the concept of data and how we can effectively map and visualize it using code.

We will learn how to structure data, use loops and objects to manage it, and employ mapping techniques to translate data values into visual elements. This will be the foundation for our upcoming project on data sculpture.


Dear Data by Giorgia Lupi and Stefanie Posavec


Edit this page on GitHub

Databases

Here are database to choose from:

Assignment

Due: Oct 7, 2025

Submit Assignment

This week, you will research data and look for a dataset that resonates with you. It could be related to your interests, a social issue, or something you find intriguing. Once you have your dataset, you can try creating a visualization using p5.js.

Examples

Readings

We don’t have required reading this week either. These are more like fun readings for inspiration.

Tutorials & Resources

Class Notebook

Bella Tsai

It's really tricky to coordinate the map when the data does not include longitude and latitude coordinates. I tried to use an image as a background, GeoJSON, and Mappa.js. And there's still no systematic solution to make the data show on a map. Data visualization is actually required so much coordinating work, THIS IS SO HARDDD.

Flora Fang

I learned how to search for data and visualize it, which I found really interesting. When I tried creating my own visualization using P5, I wanted the most frequently used emojis to appear larger while the less common ones appeared smaller, to create a more intuitive visual effect. But I wasn’t quite sure how to do it now.

Kate Chon

I had trouble connecting the data link to my code. I tried saving the dataset on excel as a CSV, but maybe the file was too large, so on p5 it wouldn't load. I reduced the complaints to rows 1-1001 in Excel, but it still wouldn't load. My current code only shows around 100 complaints, some boroughs are missing. I need help figuring out how to properly link the dataset in my code or find another solution to handle the full data.

Lin Kim

This week, I explored how data can be felt, not just seen, through the process of turning classical music data into an interactive visual experience. It was both a technical and creative challenge, finding balance between data accuracy and emotional expression. By connecting Python-based data preprocessing with p5.js visualization, I learned how musical information such as era, frequency, and composition count could be transformed into movement, color, and sound. Through debugging and iterative testing, I realized that each visual parameter—position, size, hue, and motion—carries its own meaning. The biggest insight was that emotional data visualization is more about interpretation than coding. I’m still curious about how to make 3D interactions smoother in p5.js and how to design visuals that respond more intuitively to user behavior.

Lina Lee

I was hoping for more variation in note distribution, but since the instrumentation is fairly balanced, the visual representation looks rather uniform. Perhaps we should try analyzing a different symphony or a chamber music piece.

Nancy Scanlon

I needed more help with the preload for images on top of the JSON-- making sure it was aligned.

Richard Fu

Filtering out inaccessible data points is crucial

Sarena Yadav

While working on this visualization, I realized the importance of choosing data that I could truly understand and relate to. Initially, I considered using an existing dataset, but it felt distant and abstract. By creating a dataset based on my own experiences—places I visited in NYC, the moods I felt, and my recommendations—I was able to engage more deeply with the data. At first, the project was challenging: mapping the x and y axes, deciding circle sizes, colors, and interactions, and ensuring everything displayed cohesively felt overwhelming. However, as the circles took shape and the interactive panels began to work, the visualization came alive, and it was incredibly exciting to see my personal experiences represented visually. I also learned the value of subtle interactions, like flickering circles, to make the visualization dynamic. Overall, this project taught me how to translate personal data into an engaging, meaningful visual story.

Yiling Yang

If I want to include typhoon trajectories instead of single points, how can I efficiently organize and draw a large amount of data in p5.js?

Zoe Liu

ChatGPT 说: Visualization is a tricky process. You not only have to decide which columns to show, but also pick and filter the data so the picture looks balanced, instead of letting one weird data point push everything into a corner.