Week 6

Project file 1
Live Demo

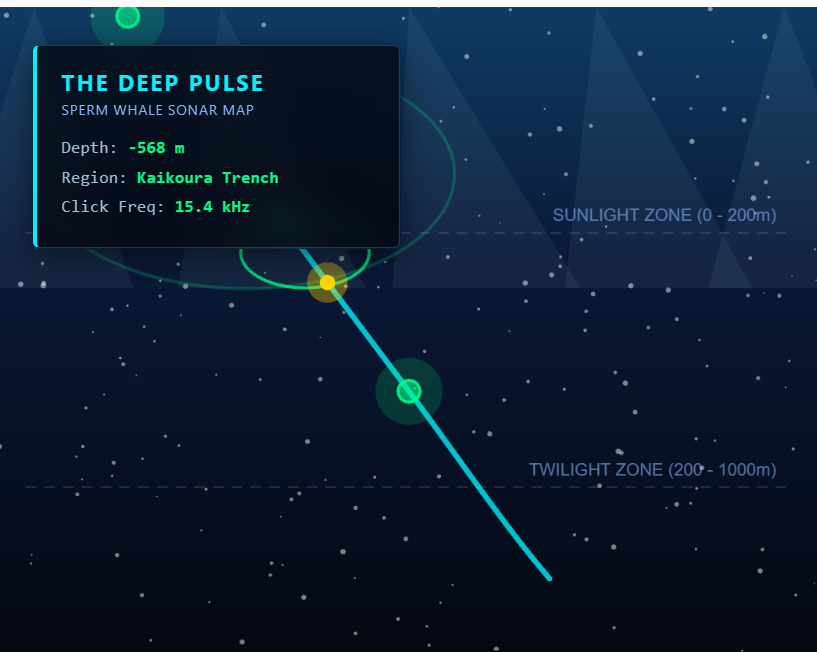
The Deep Pulse: Oceanic Sonar & Sperm Whale Migrations The Deep Pulse is an interactive data visualization combining marine biology and underwater acoustics as the prototype for a "Data Sculpture" project. It visualizes the sperm whale’s 1,000-meter vertical dive across three oceanic zones: Epipelagic (0–200m), Mesopelagic (200–1000m), and Bathypelagic (>1000m). By mapping GPS telemetry, population data, and 15.4 kHz echolocation clicks into a real-time p5.js canvas, the piece translates abstract environmental metrics into expanding sonar rings and deep-sea luminescence, inviting viewers to experience the silent rhythm and scale of deep-ocean life.

Credits & References

AI agents

Week 3

Project file 1
Live Demo

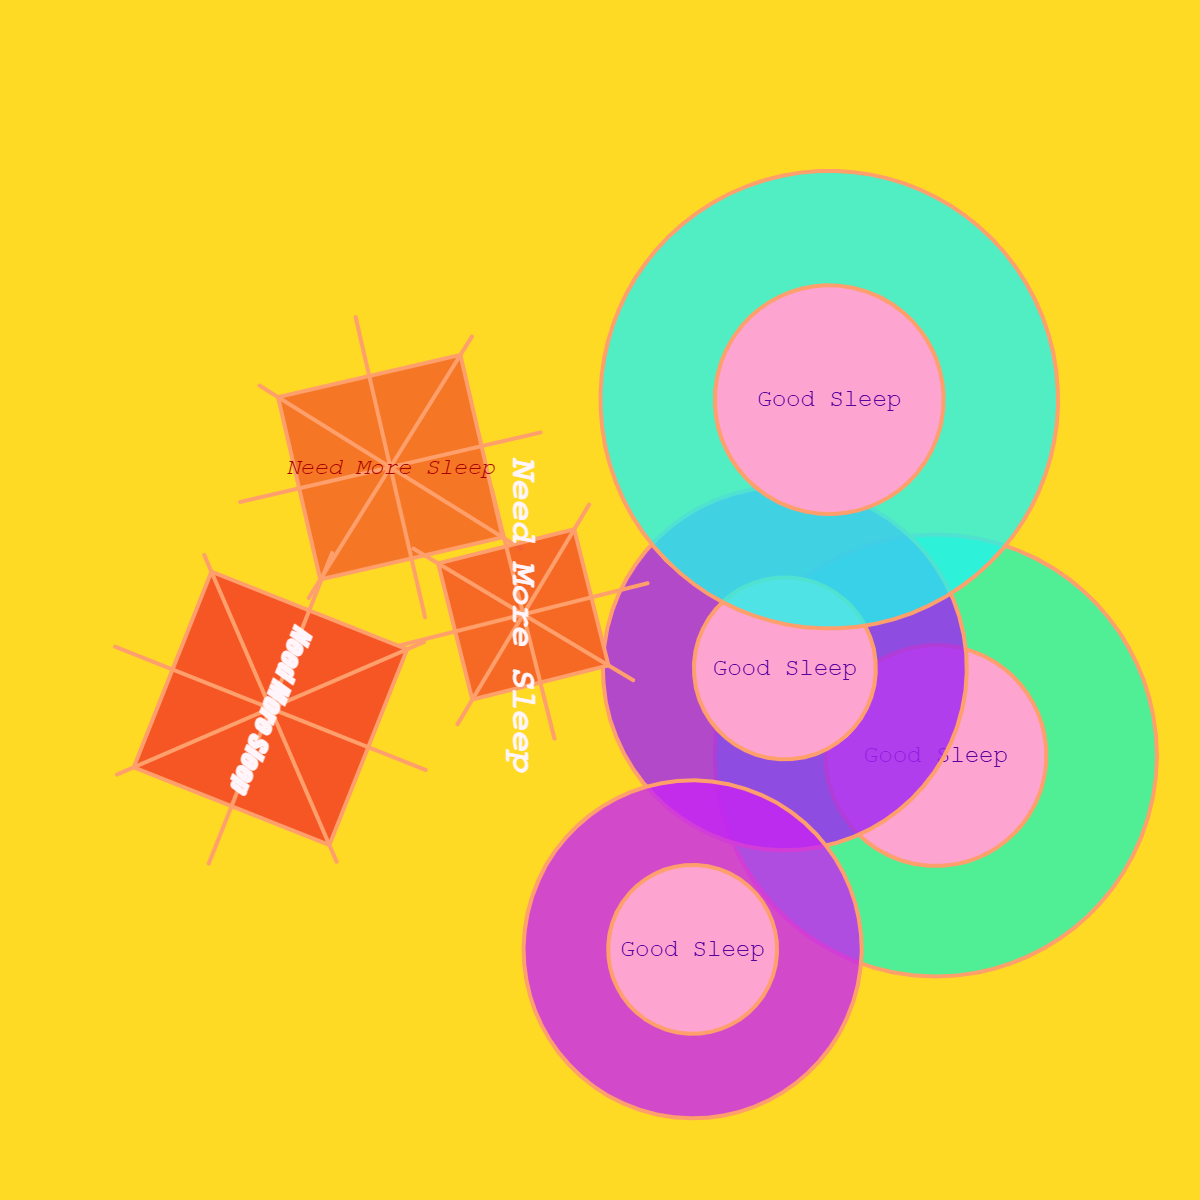
Source Material : Daily sleep quality data / personal emotional fatigue states. Rule 1 (Form): If the state is "Good Sleep", the system generates soft, concentric circles with gentle pastel colors (Cyan, Purple, Pink). If the state is "Need More Sleep", the system generates sharp, rotated squares with overlapping diagonal burst lines ("asterisk" rays) in urgent orange-red tones. Rule 2 (Typography): "Good Sleep" stays horizontal and calm with light monospaced text. "Need More Sleep" rotates alongside its bounding box, using variable font weights and colors (Dark Blue, White, Crimson) to express tension and disruption. What it Reveals vs. What it Hides Reveals: The spatial tension and collision between rest and exhaustion. When square shapes overlap with circles, it visibly displays how sleep deprivation intrudes upon peaceful rest. Hides: The raw quantitative data (such as exact sleep hours). Instead, it turns numerical sleep tracking into an emotional visual language. Intentional Randomness & Expressive Constraints Consistency: The bright yellow background and the geometric taxonomy (Circles = Rest, Squares = Fatigue) remain 100% consistent so every output is recognized as part of the same encoded language. Expressive Variation: The spatial placement, rotation angles, and opacity variations reflect unpredictable daily fatigue levels. Constraining the color palette prevents the variation from feeling chaotic or arbitrary, maintaining strong system meaning.
Credits & References

NON

Week 1

Project file 1
Live Demo

What is code? To me, code is the unique fingerprint and identity embedded in everything. This shows Lifestyle & Emotional Habits. For example, I view the worn out toothbrushes as a physical code. The bent, frayed bristles actually encode information about a person’s daily stress, lifestyle, and habits. Someone brushing aggressively might be releasing anxiety, while a worn brush shows a calm routine. These small objects act as a secret info, encrypting our hidden emotions and personal health data.

Credits & References

Some picture is from Pinterest

Week 4

Project file 1
Live Demo

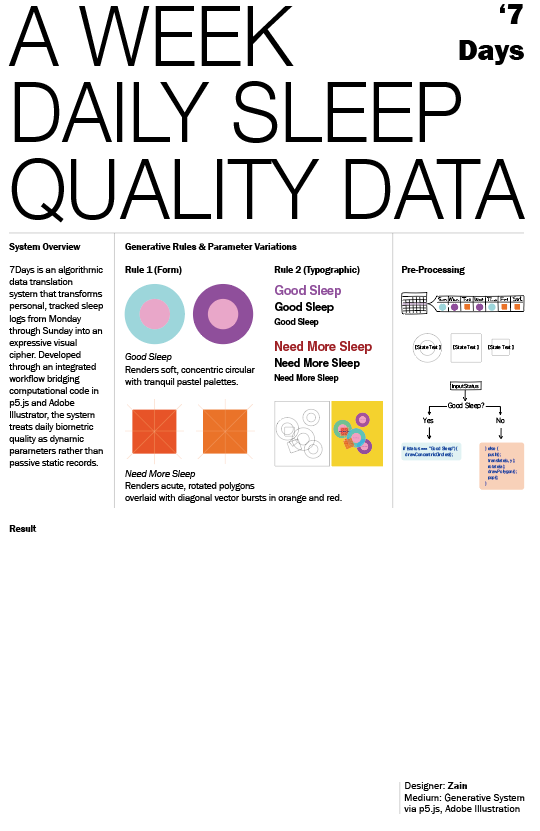
7Days: Daily Sleep Quality Data, 2026 Generative system print (p5.js, Adobe Illustrator) 7Days is an algorithmic data translation system that transforms personal, tracked sleep logs from Monday through Sunday into an expressive visual cipher. Developed through an integrated workflow bridging computational code in p5.js and Adobe Illustrator, the system treats daily biometric quality as dynamic parameters rather than passive static records.

Credits & References

NONE

Week 2

Project file 1
Live Demo

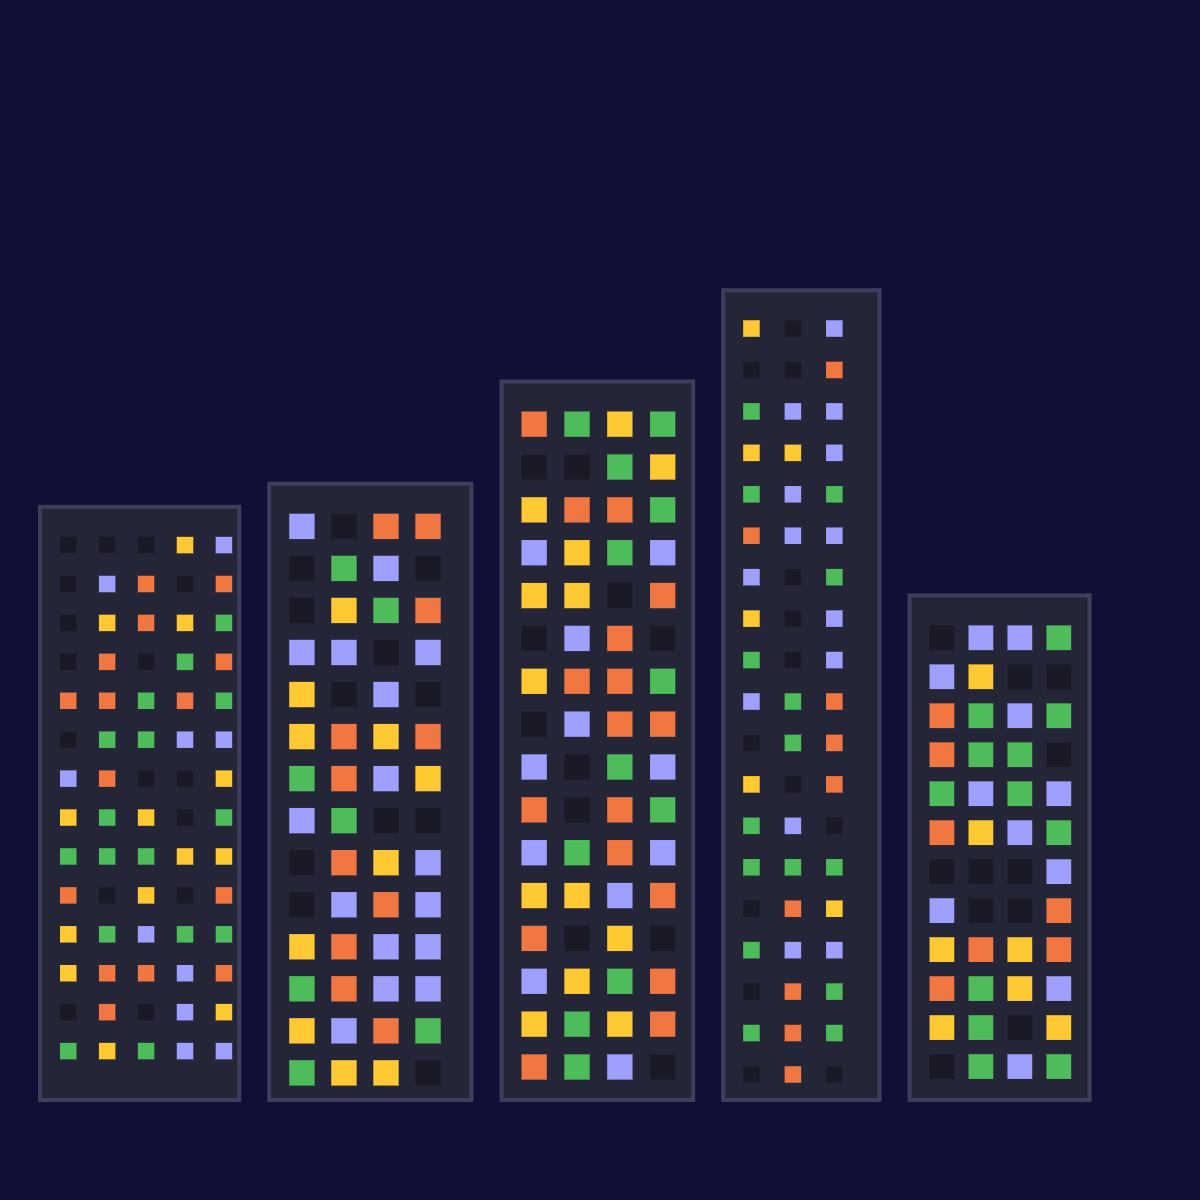
I generative the project explores the concept of code variables through the lens of modern urban architecture, representing the city as a living, ever changing system where daily human life maintains a continuous rhythm despite constant transformation. By translating a building and its glowing grid into a dynamic coding system in p5.js, the sketch continuously reorganizes 5 core variables: the overall height of the building, its structural width, the size of windows, the density of the window arrangement, and the vibrant array of light colors that fill each room. As these values shift with every mouse click, the architecture alters dramatically, ranging from tall towers with scattered neon lights to shorter, wider structures glowing with warmer tones,but still the fundamental identity of the building remains instantly recognizable. Lastly, the fluctuating windows serve as a visual network that captures the quiet daily variations, subtle movements, and collective living patterns unfolding inside the city.

Credits & References

P5.js, Yt teaching

Week 1

Project file 1
Live Demo

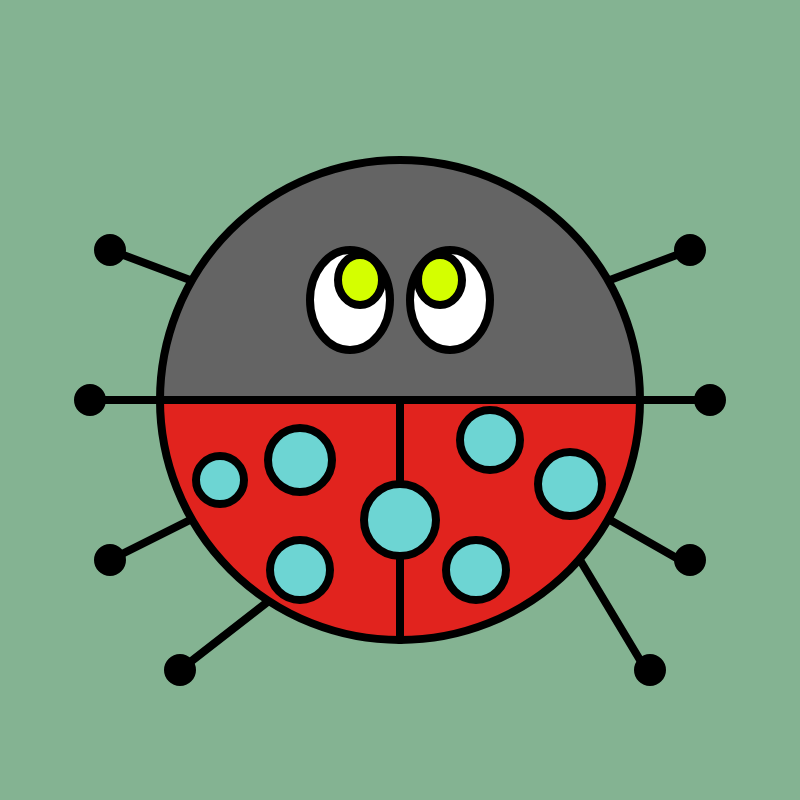
For this week's project, I created a cute, active ladybug using code! Since this was my first time working with p5.js, I wanted to focus on combining simple shapes and learning how positioning works. The design is built completely out of basic shapes like circles, lines. The body is a large circle divided into two sections, a grey top for the head and a bright red bottom for the shell. I gave the ladybug wide, expressive eyes with bright green pupils looking up to give it a curious personality. Instead of traditional black spots, I chose light blue dots to make the color scheme feel a bit more fun and unique. The trickiest part was definitely figuring out the positions and coordinates. Fine tuning the placement of the six legs and making sure the blue spots were balanced across the shell took a lot of trial and error. Every element had to be carefully adjusted using X and Y coordinates.

Credits & References

https://beta.p5js.org/reference/p5/createModel/