Week 7
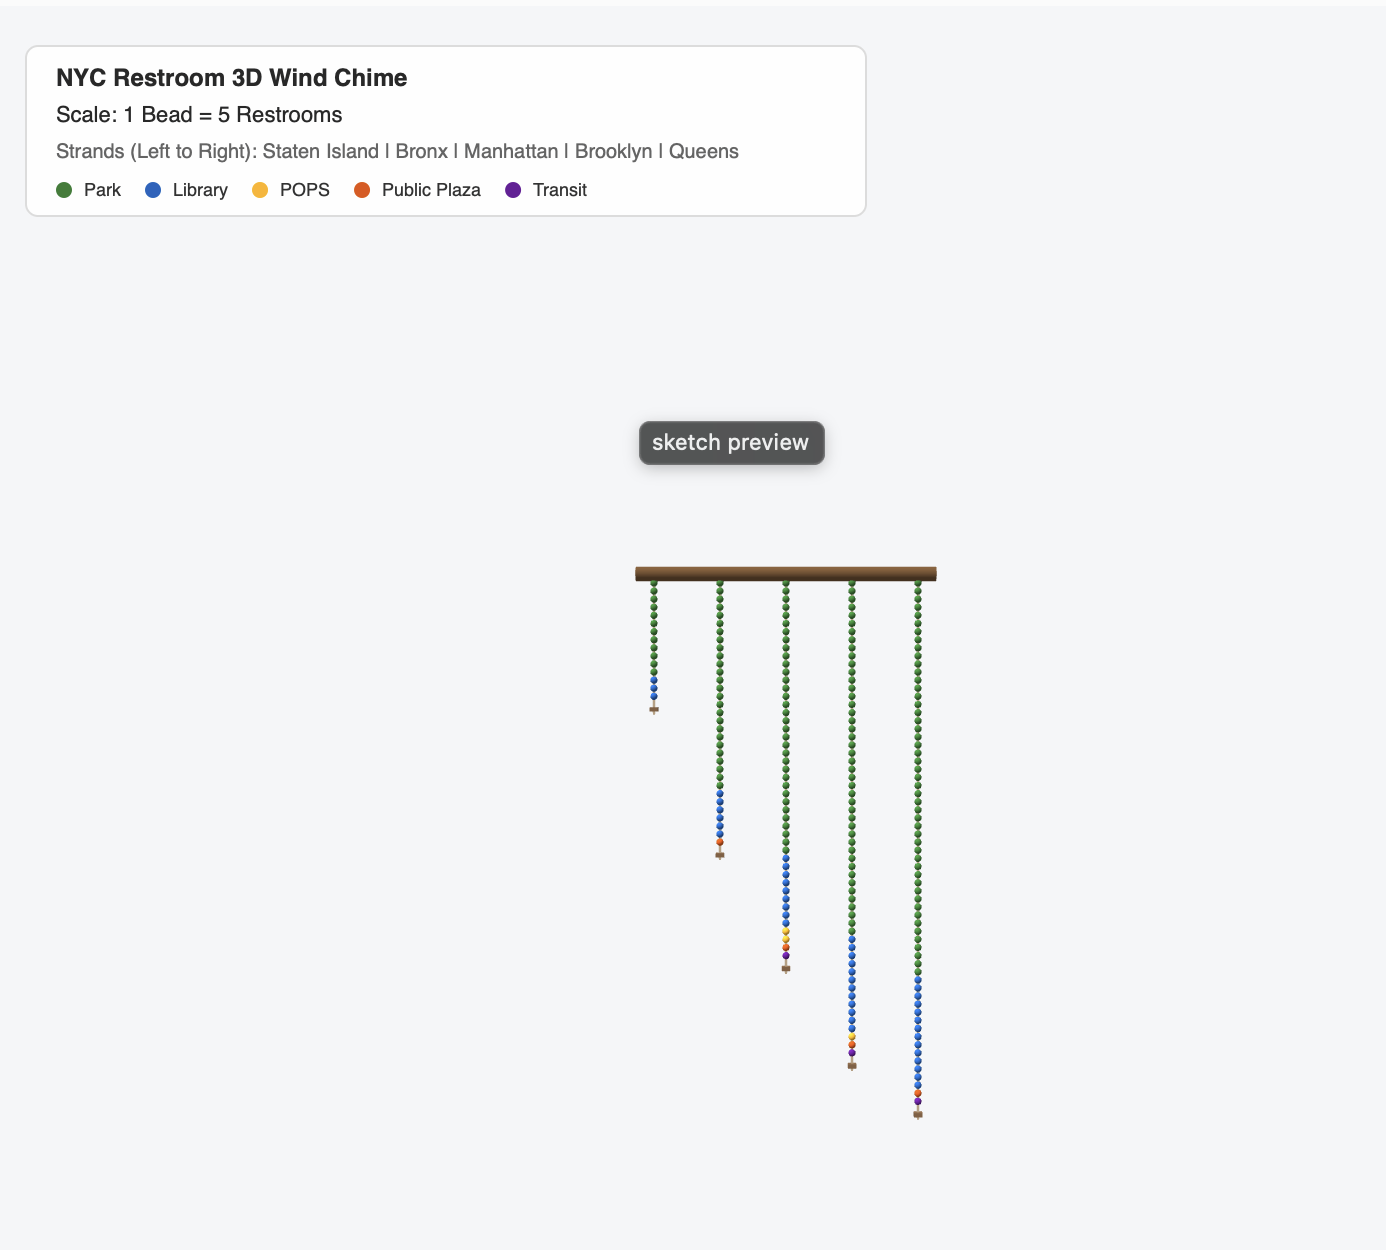
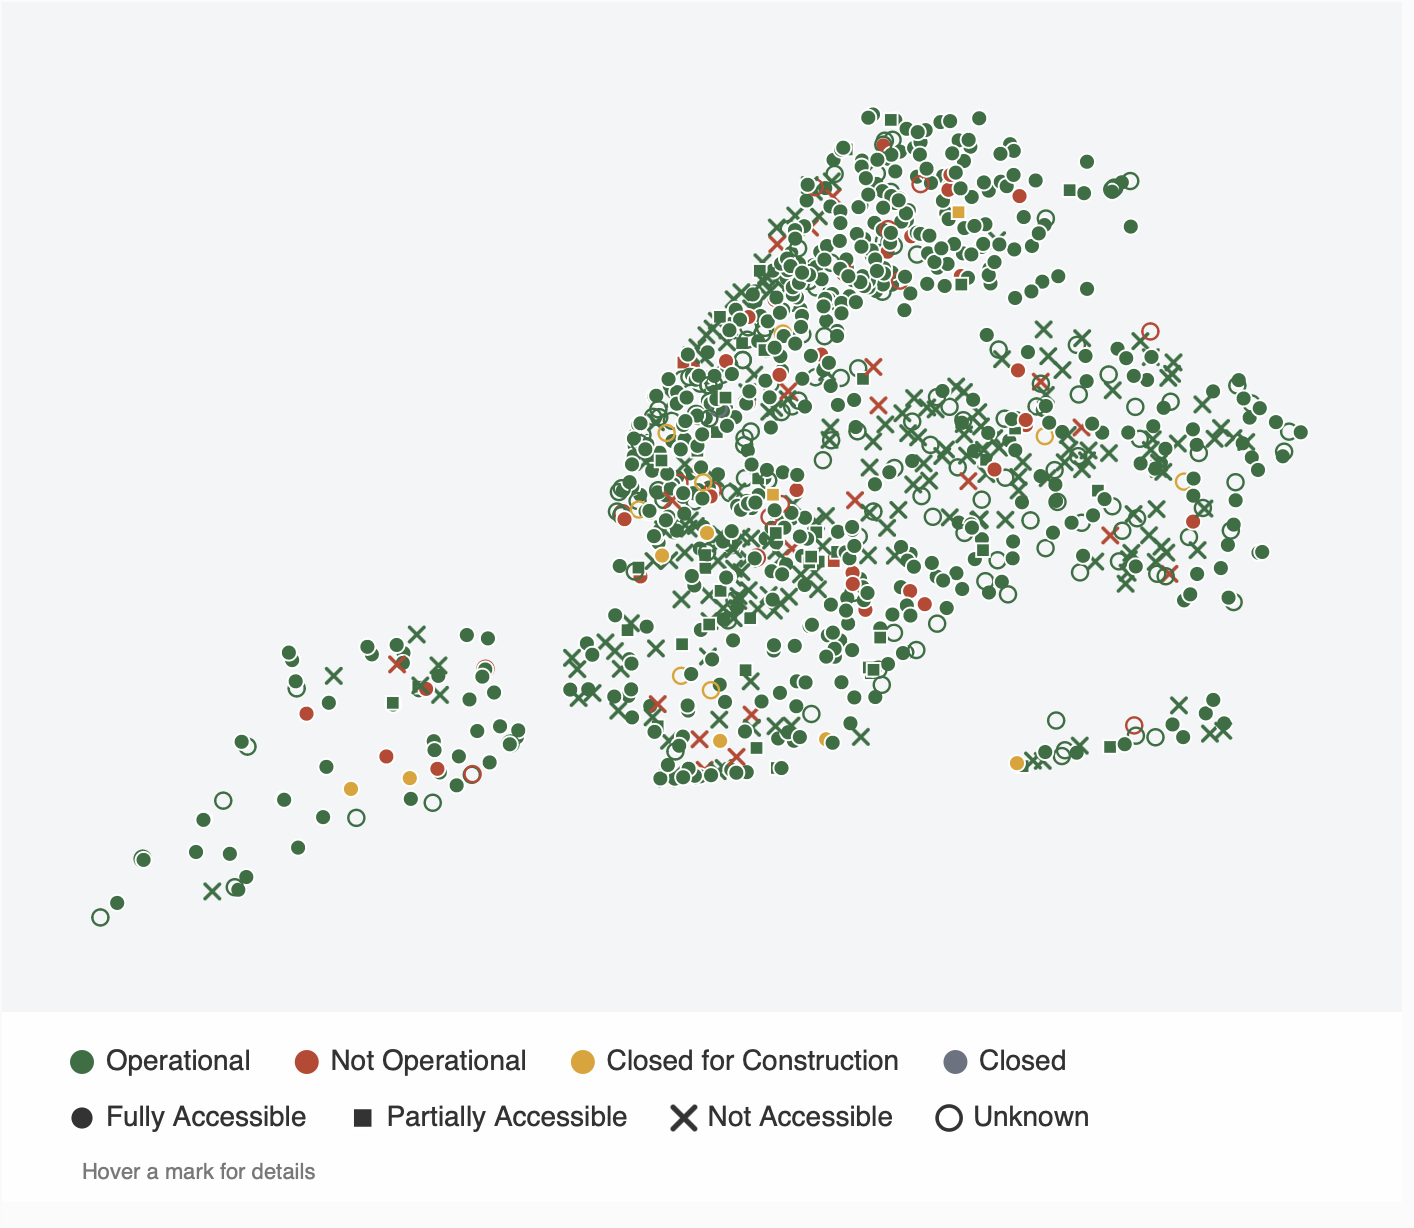
In visualizing my data in 3D form, I'm more interested in representing the mass of things. So how many public bathrooms are there according to categories. That's why I chose to categorize public restrooms into park, library, public plaza, etc. 1 bead represent 5 restroom and each strand represents 1 borough. Through this visualization, I'm able to see a pattern in restrooms, of what categories that have the most restroom, which borough has the most or least public restrooms.
Credits & References
Claude, Gemini, Philip (friend)