Week 6
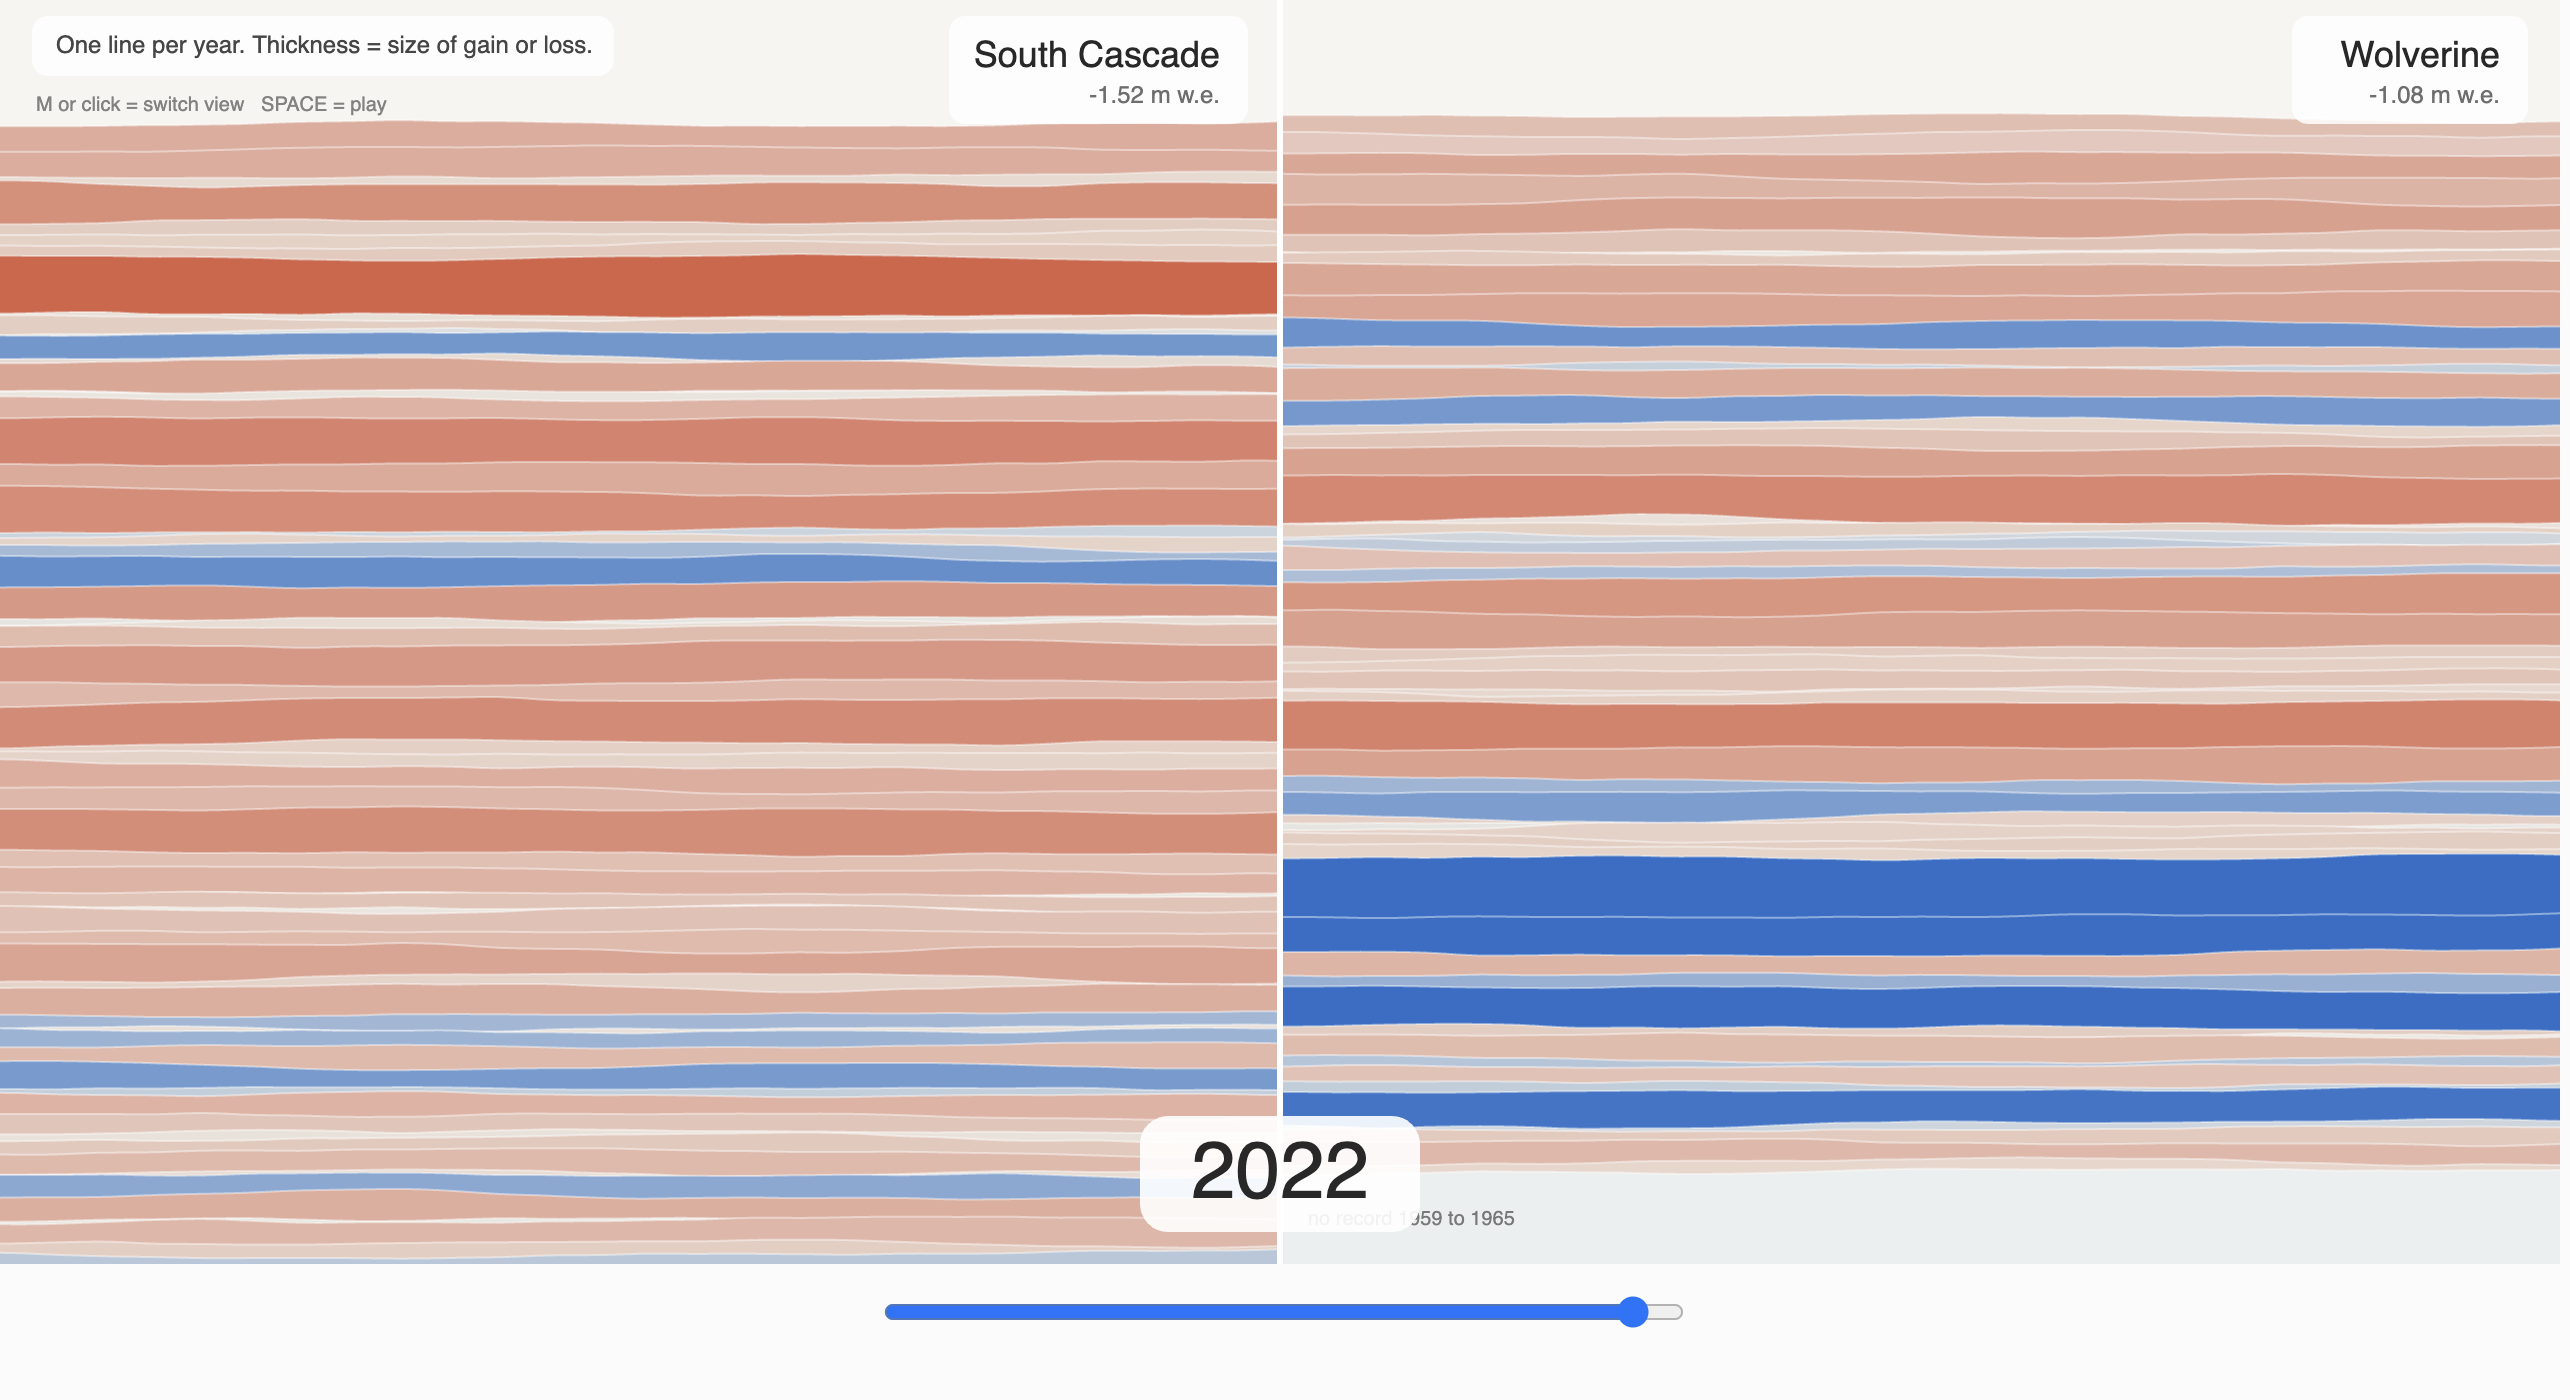
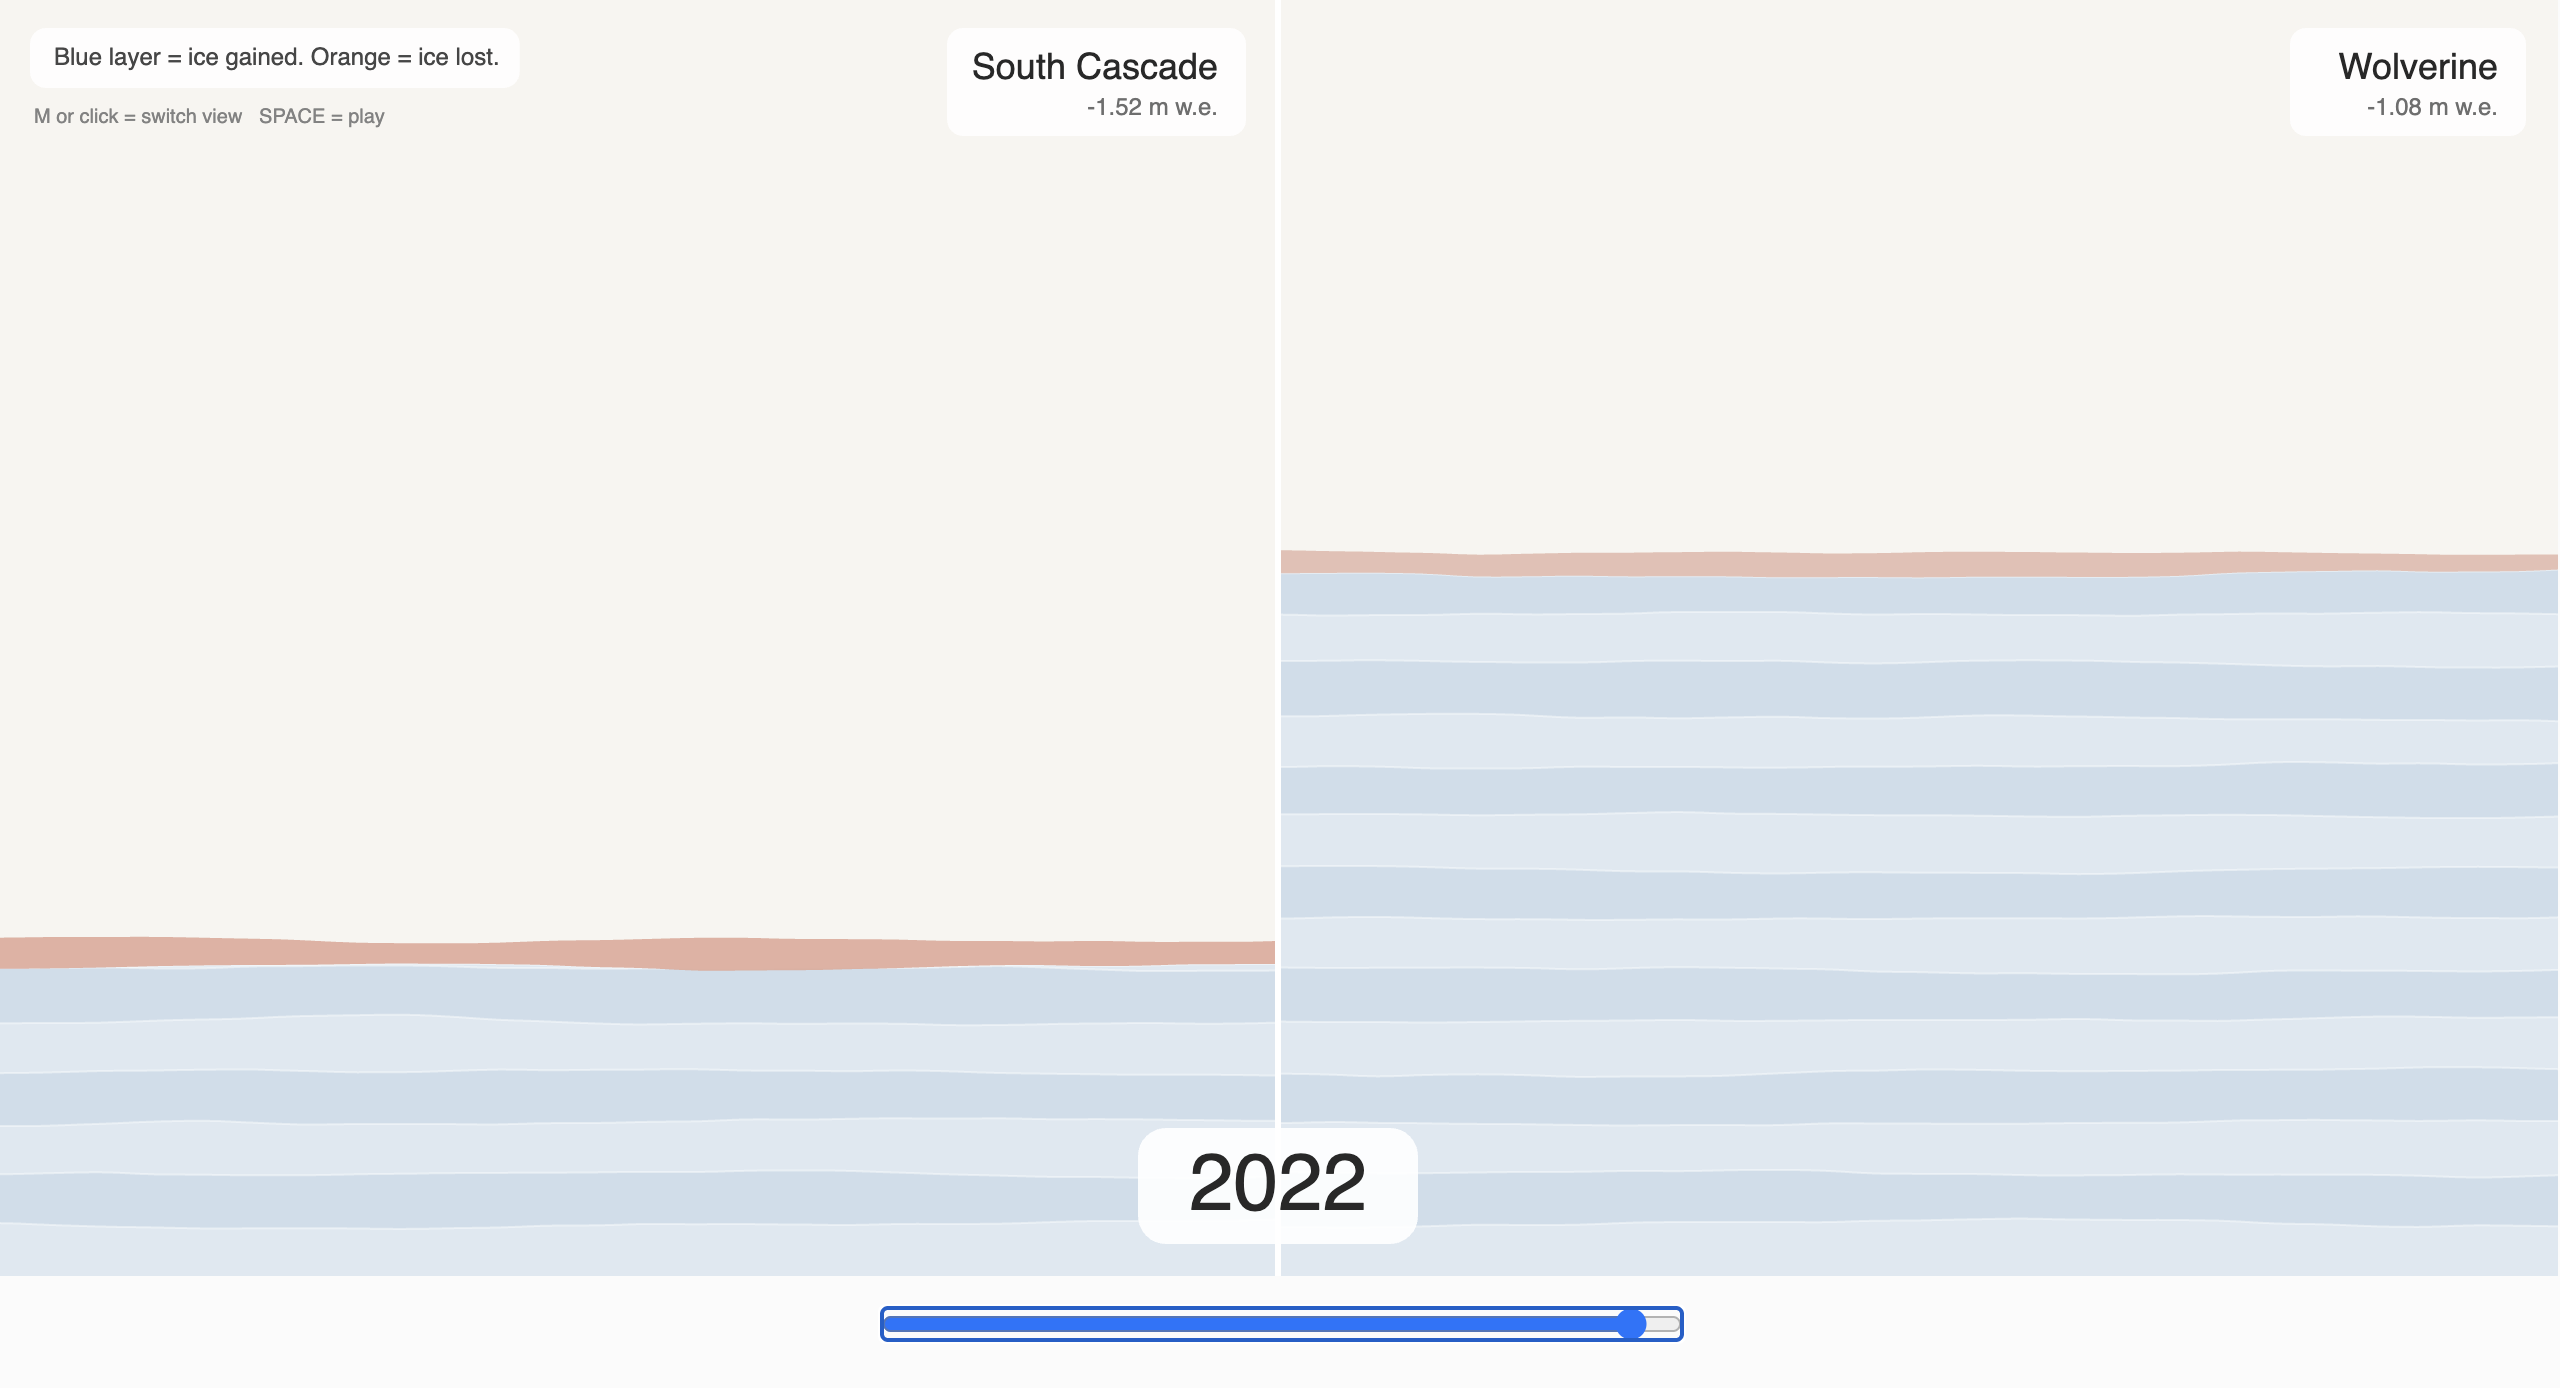
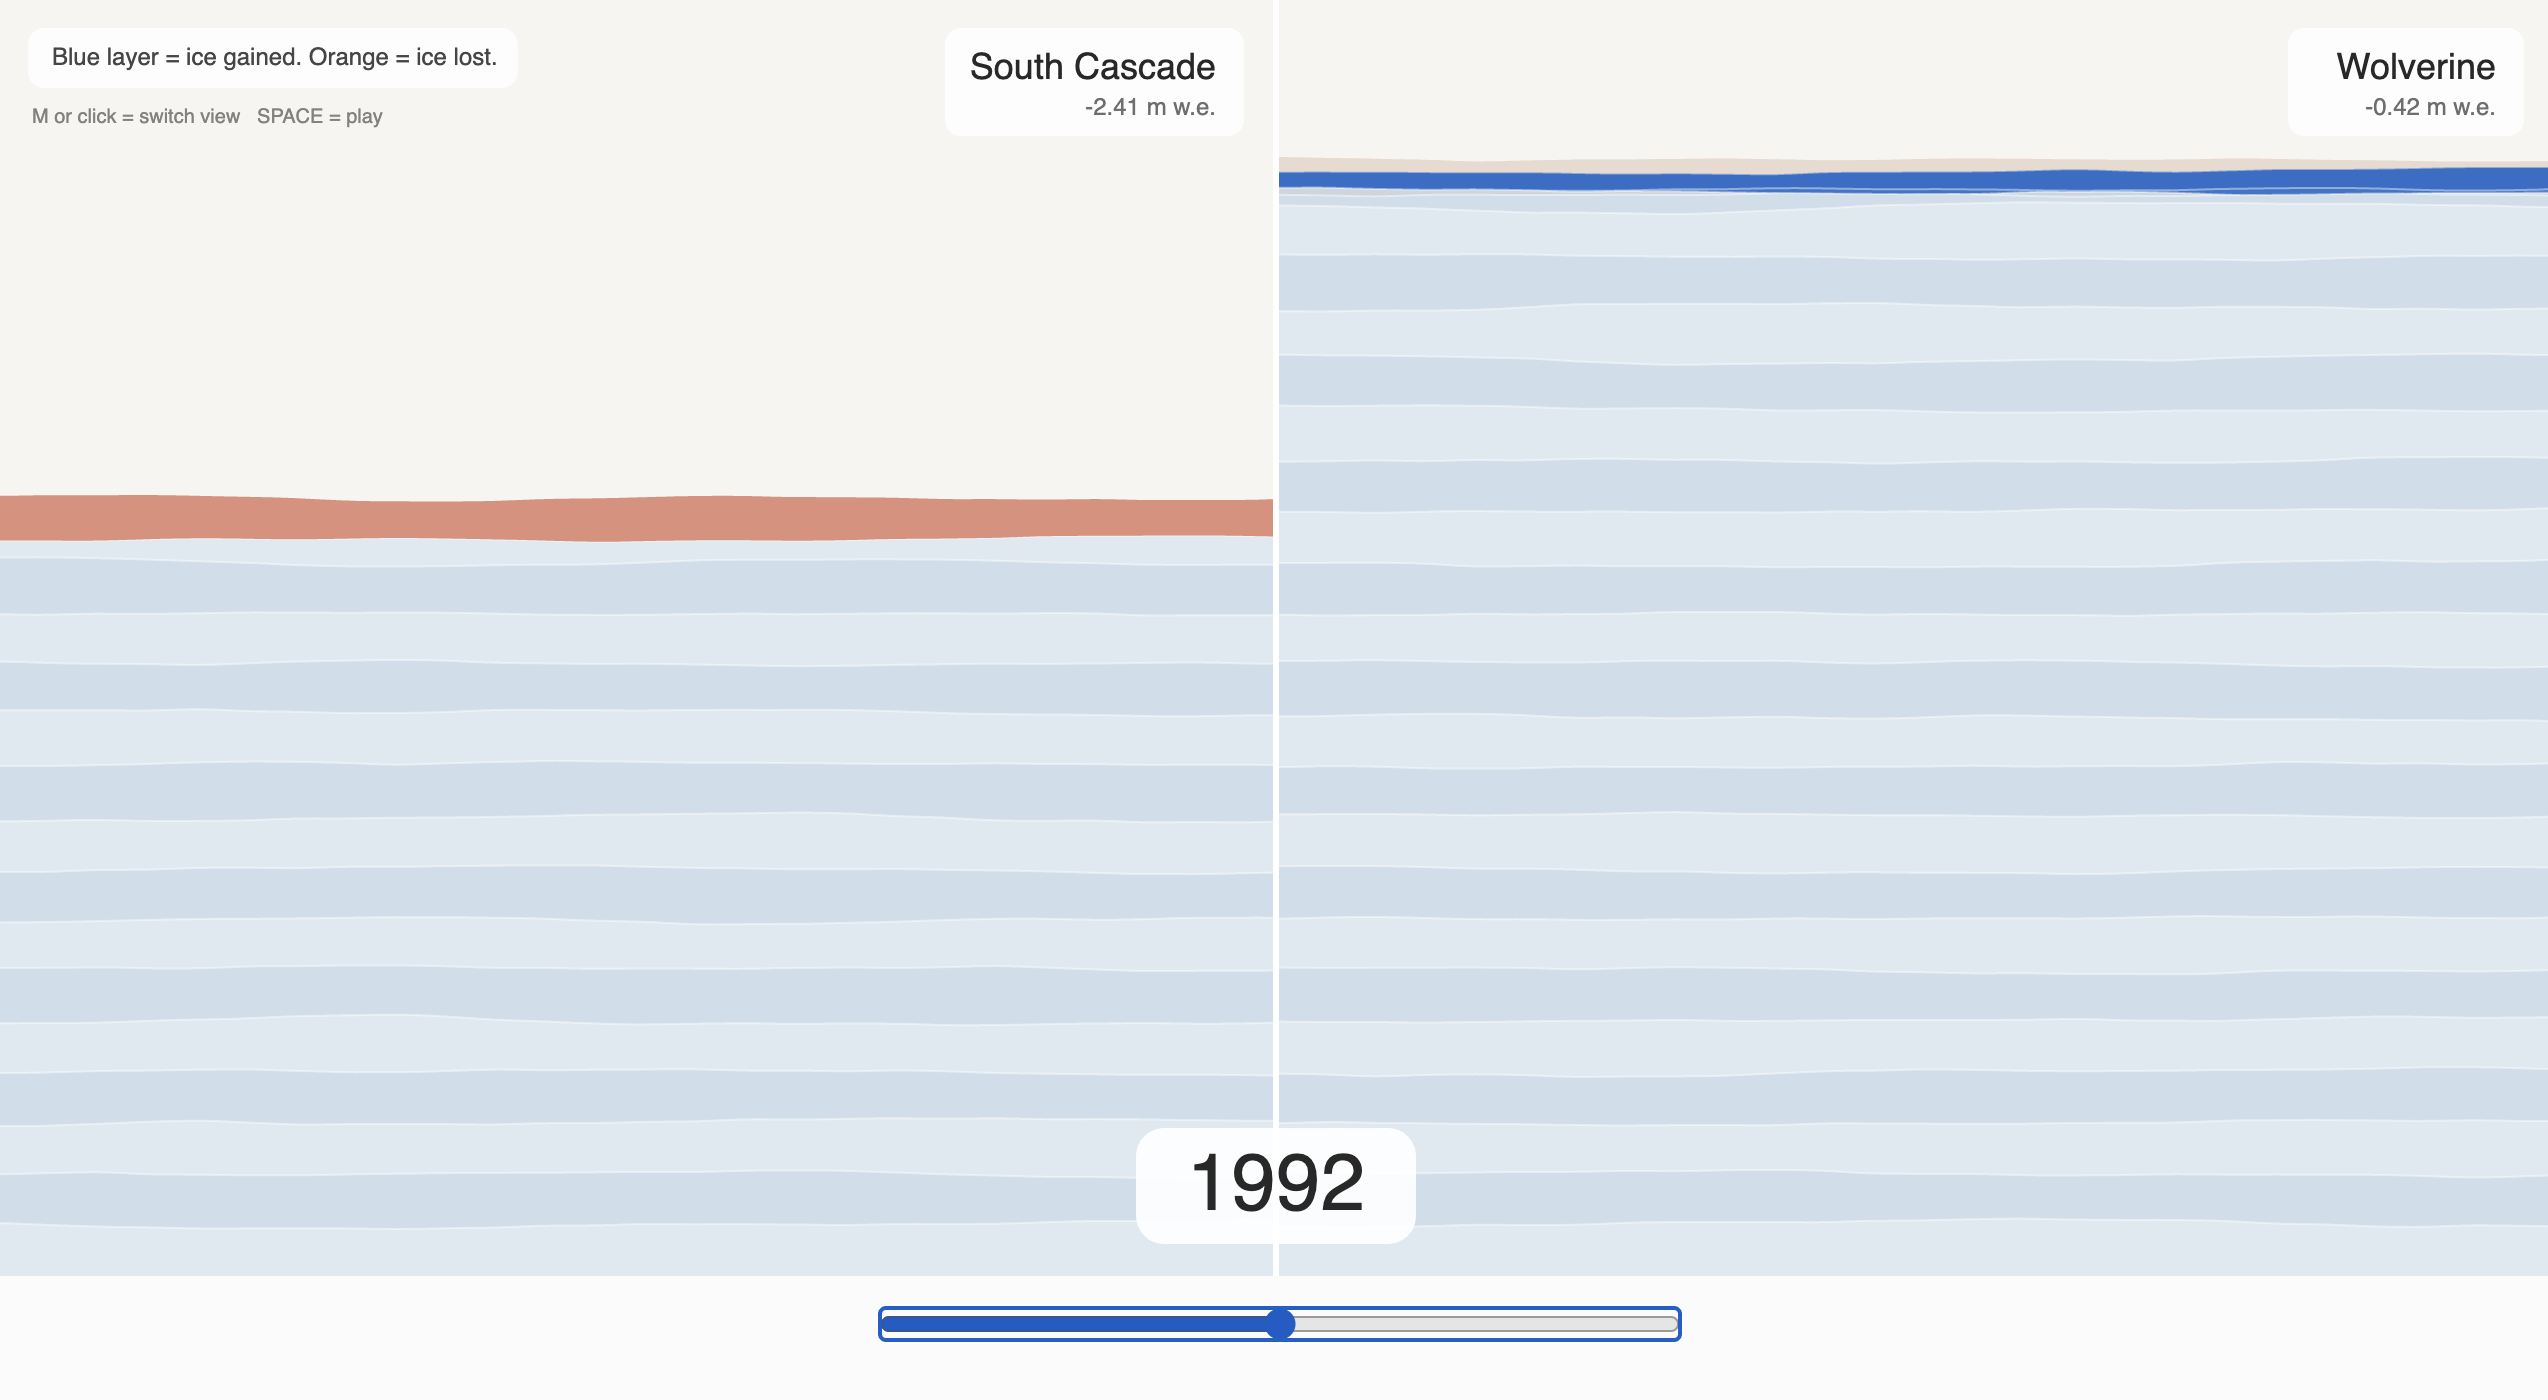
STRATA: Glacier Mass Loss Visualization Mountain glaciers are reservoirs of frozen water and compacted snow dating back thousands of years. Over the years, there has been an observed decrease in glacial mass, attributed to increased greenhouse gases that are warming our atmosphere, creating warmer than average summers. Glacier change in North America has a number of negative impacts on things such as sea level, water resources, fisheries, and more. With new data from the 2025 survey of glacial mass, there was a record amount of loss on the Benchmark Glaciers in the contiguous United States and Alaska. The South Cascade Glacier experienced the largest loss on record, but the Wolverine Glacier in Alaska gained for the first time since 2012. This creates a unique duality: despite overall mass loss, the Wolverine Glacier increased. To compare these two, I created a sketch that runs two ways. In the first, you can toggle or press play to see the glacier levels over time. Years where mass was gained are expressed in blue, light blue for small gains and dark blue for large gains. For years of loss, light orange represents small loss while dark orange shows a year of large loss. The thickness of the stripe also represents how much of a loss or gain. Then, if you click or press M, you are able to see the reverse, where the design builds up over time, creating a "barcode" of the whole history. Side by side, the two glaciers show that one year of gain does not undo a long decline. Wolverine's 2025 rise is real, but it appears against a record of mostly loss, while South Cascade's ice sheet thins to a sliver. STRATA turns decades of measurements into layers you can scrub through, so the loss becomes something you can watch happen rather than only read as a number.
Credits & References
Claude, USGS for information and data regarding the glaciers.