Week 7
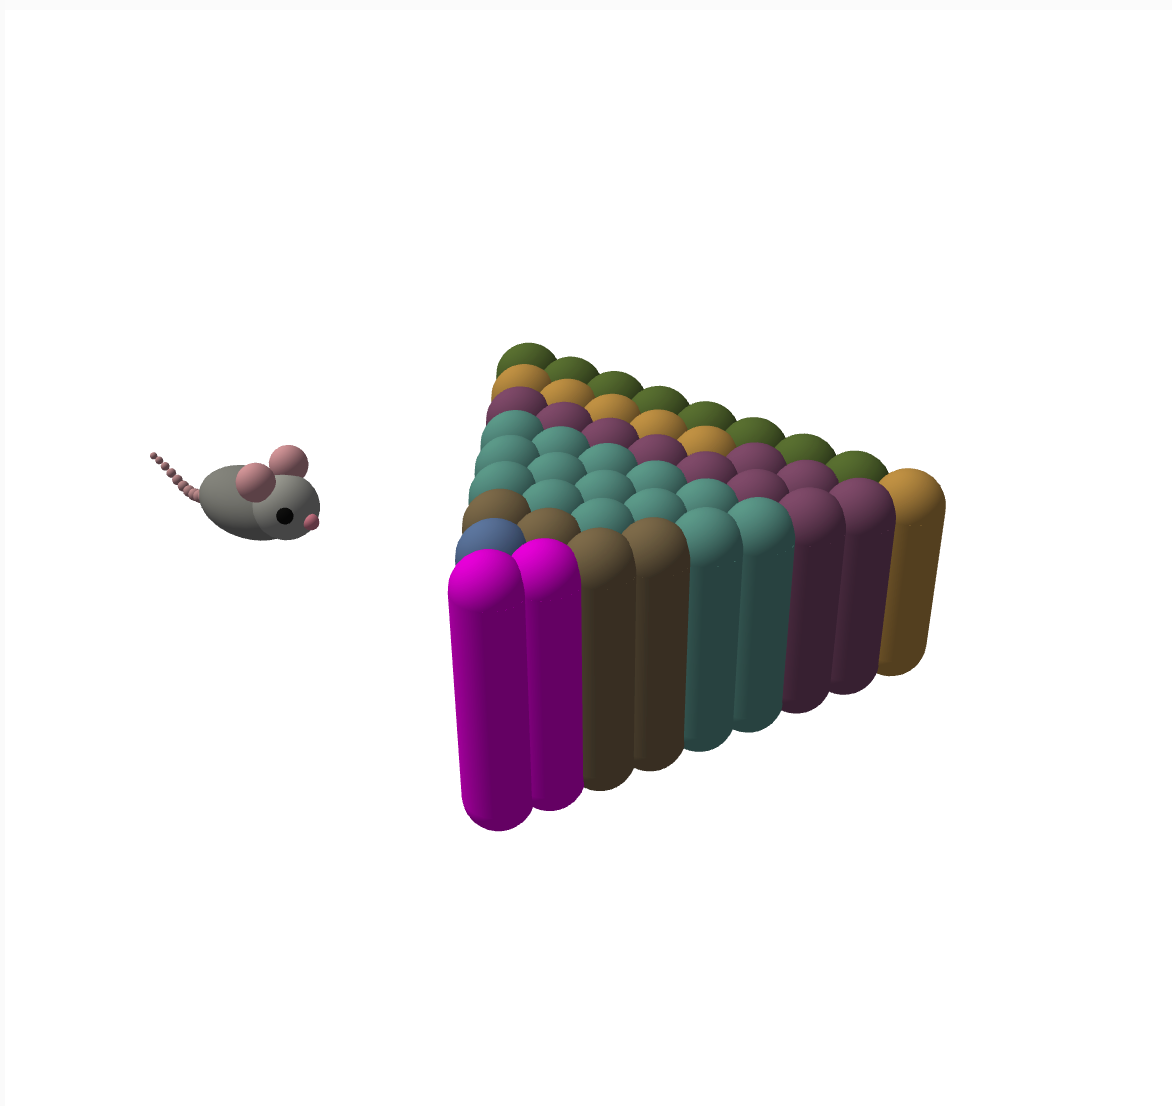
My project focuses on restaurant inspection data from the New York City Health Department. I collected restaurant violation records and organized them into six categories. These include pest problems, such as rats and cockroaches, improper food temperature control or sanitization, and other potential food safety hazards. For the visualization, I divided New York City into its five boroughs, such as Brooklyn and Queens. Each borough is represented by a slice of cake. On the surface of each cake slice, I use visual elements inspired by bacteria and mold to represent different types of health violations. Through their shapes, colors, and proportions, I want to show how common each type of violation is in different boroughs. My goal is to turn abstract inspection data into something visually striking, making it easier for people to compare restaurant hygiene conditions across New York City.
Credits & References
youtube、rednote、slides、NYCopendata、chatgpt